Note
Go to the end to download the full example code.
BigWig Track#
Create a simple BigWigTrack Track.
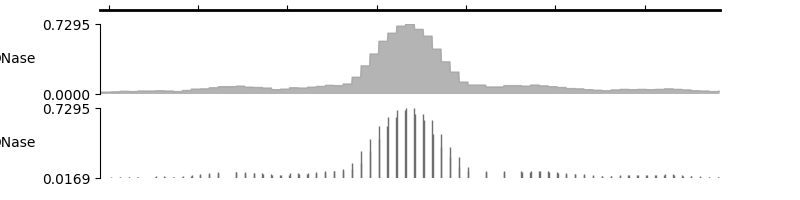
array([<Axes: title={'center': 'chr19'}, ylabel='DNase'>,
       <Axes: ylabel='DNase'>], dtype=object)
from pygv.viewer import GenomeViewer
from pygv.tracks.bigwig_track import BigWigTrack
gv = GenomeViewer()
track = BigWigTrack(
    "../examples/data/K562_DNase_hg38_ENCFF413AHU.chr19.bigWig",
    name="DNase", )
gv.add_track(track)
bar_track = BigWigTrack(
    "../examples/data/K562_DNase_hg38_ENCFF413AHU.chr19.bigWig",
    name="DNase", plot_type="bar")
gv.add_track(bar_track)
gv.plot("chr19", 7496780, 7498169)
Total running time of the script: (0 minutes 0.115 seconds)