Note
Go to the end to download the full example code.
Paired Strand-Specific BigWig Track#
Create a PairedStrandSpecificTrack to show signals
on the forward strand (pl_track) and the reverse strand (mn_track).
This can be useful for presenting data from TSS-assays like GRO-cap/PRO-cap, NETCAGE, etc
and NascentTranscript-assays like PRO-seq, TT-seq, etc.
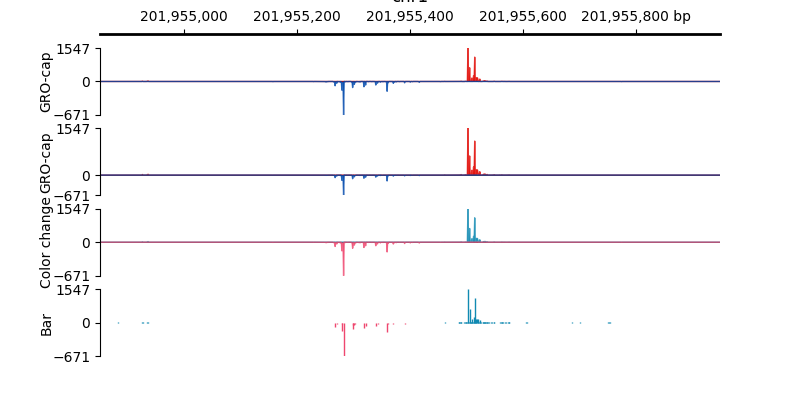
array([<Axes: title={'center': 'chr1'}, ylabel='GRO-cap'>,
       <Axes: ylabel='GRO-cap'>, <Axes: ylabel='Color change'>,
       <Axes: ylabel='Bar'>], dtype=object)
from pygv.viewer import GenomeViewer
from pygv.tracks.bigwig_track import PairedStrandSpecificTrack
gv = GenomeViewer()

# draw positive and negative values independently
independent_track = PairedStrandSpecificTrack(
    "../examples/data/K562_GROcap_hg38_pl.chr1.bw",
    "../examples/data/K562_GROcap_hg38_mn.chr1.bw",
    draw_y_independently=True,
    name="GRO-cap", y_label_rotation="vertical", y_label_ha="center")
gv.add_track(independent_track)

# draw positive and negative values like usual
dependent_track = PairedStrandSpecificTrack(
    "../examples/data/K562_GROcap_hg38_pl.chr1.bw",
    "../examples/data/K562_GROcap_hg38_mn.chr1.bw",
    draw_y_independently=False,
    name="GRO-cap", y_label_rotation="vertical", y_label_ha="center")
gv.add_track(dependent_track)

# change the colors for signals on the two strands:
diff_color_track = PairedStrandSpecificTrack(
    "../examples/data/K562_GROcap_hg38_pl.chr1.bw",
    "../examples/data/K562_GROcap_hg38_mn.chr1.bw",
    draw_y_independently=True, pos_color="#118ab2", neg_color="#ef476f",
    name="Color change", y_label_rotation="vertical", y_label_ha="center")
gv.add_track(diff_color_track)

# Bar plot
bar_track = PairedStrandSpecificTrack(
    "../examples/data/K562_GROcap_hg38_pl.chr1.bw",
    "../examples/data/K562_GROcap_hg38_mn.chr1.bw",
    plot_type="bar", draw_y_independently=True, pos_color="#118ab2", neg_color="#ef476f",
    name="Bar", y_label_rotation="vertical", y_label_ha="center")
gv.add_track(bar_track)

gv.plot("chr1", 201954851, 201955948)
Total running time of the script: (0 minutes 0.235 seconds)