Viewer#
- class pygv.viewer.GenomeViewer(font_name=None, font_size=None, alternative_color_map=None, hspace=0.2, inward_ticks=None, n_ticks=None)#
Genome Viewer
- Examples
>>> from pygv.viewer import GenomeViewer
>>> from pygv.tracks import gtf_track
>>> gv = GenomeViewer()
>>> gencode_track = gtf_track.GtfTrack(
>>>     "~/gencode.v34lift37.annotation.sorted.gtf.gz",
>>>     name="GENCODE", show_genes=True, show_transcript_id=True,
>>>     filters=lambda x: x.transcript_id in {"ENST00000332995.11_1", "ENSG00000112137.17_4",
>>>                                           "ENST00000379350.5_1", "ENST00000379335.7_1"},
>>>     annotation_formatter=lambda x: x.split(".")[0]
>>> )
>>> gv.add_track(gencode_track)
>>> gv.plot("chr6", 12714999, 13292716)
>>> plt.show()
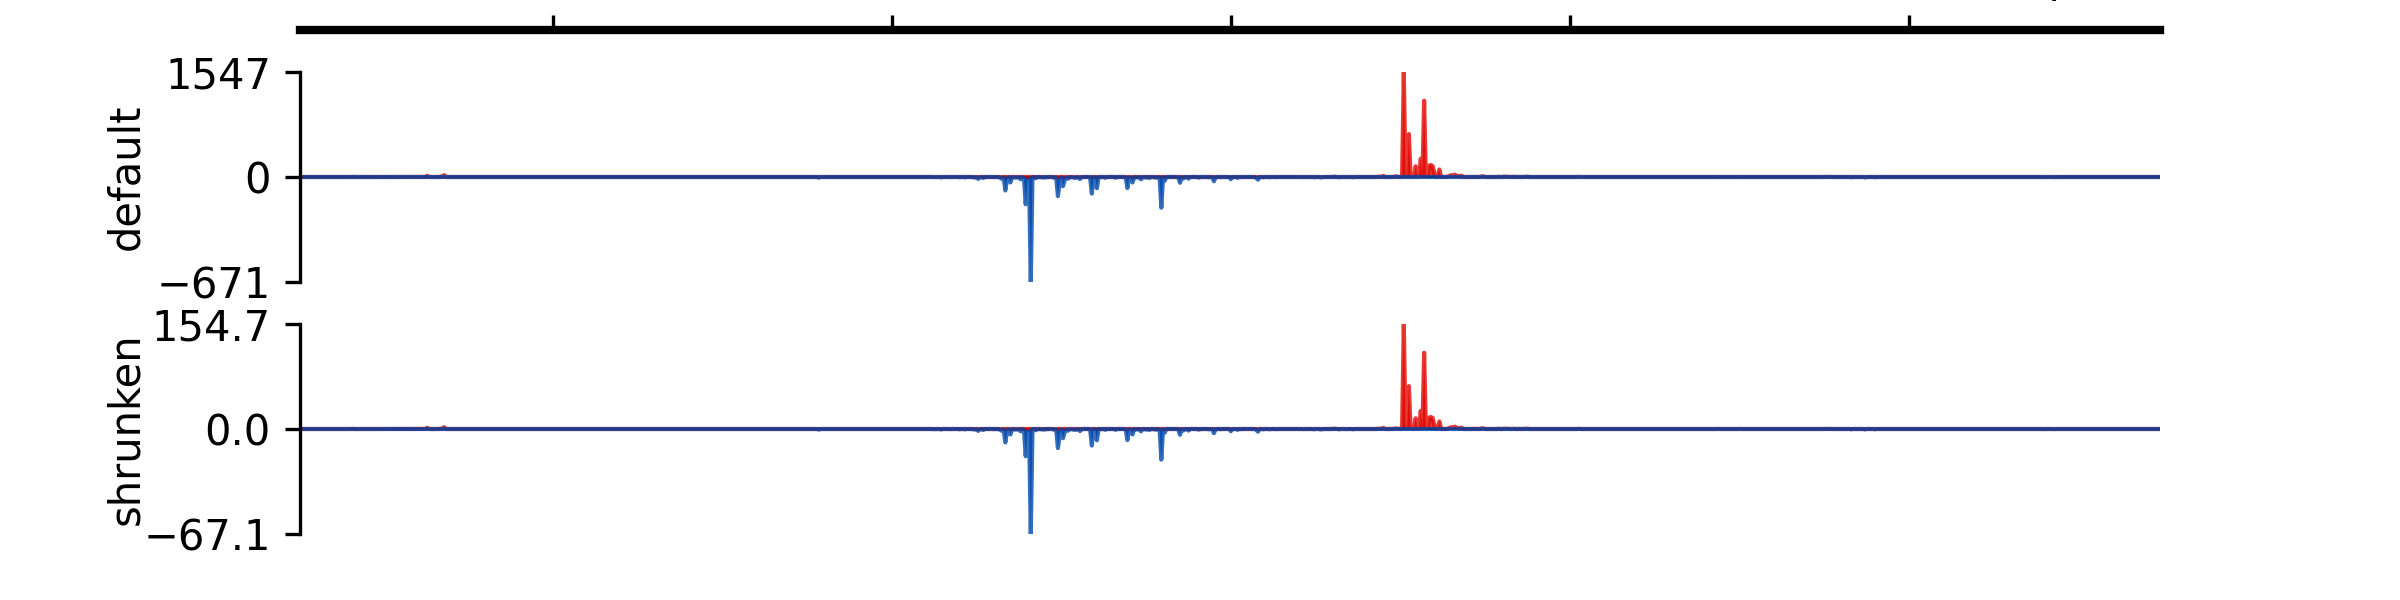
- add_group_autoscale(track_idx: tuple[int, ...] | list[int])#
Add group autoscale
- Parameters:
track_idx (Union[tuple[int, ...], list[int]]) – Indexes of the tracks to be scaled together
Examples


- add_group_autoscale_by_name(track_name: tuple[str, ...] | list[str])#
Add group autoscale
- Parameters:
track_name (Union[tuple[str, ...], list[str]]) – Names of the tracks to be scaled together
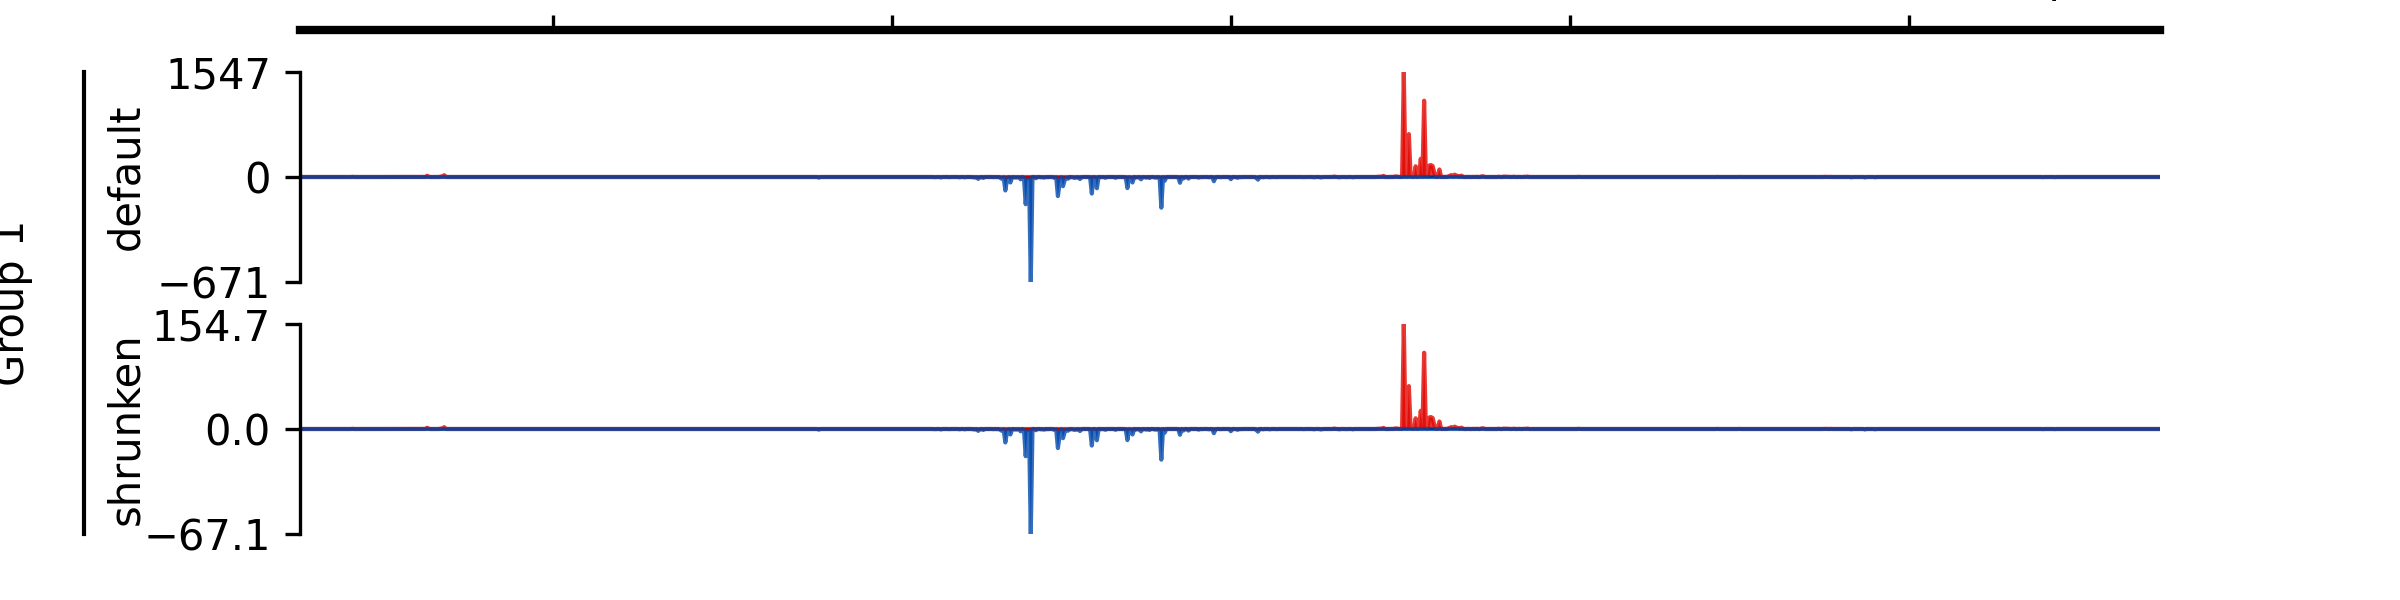
- add_group_label(start_track_idx: int, end_track_idx: int, label: str, x=0.02, x_line_offset=0.015)#
Add group label
- Parameters:
start_track_idx (int) – Index of the start track (0-based)
end_track_idx (int) – Index of the end track (0-based)
label (str) – Group label
x (float) – X-position for the label in figure coordinates (default 0.02).
x_line_offset (float) – Offset for the line from the label in figure coordinates (default 0.015).
Examples


- add_group_label_by_name(start_track_name: str, end_track_name: str, label: str, x=0.02, x_line_offset=0.015)#
Add group label by track names
- Parameters:
start_track_name (str) – Name of the start track
end_track_name (str) – Name of the end track
label (str) – Group label
x (float) – X-position for the label in figure coordinates (default 0.02).
x_line_offset (float) – Offset for the line from the label in figure coordinates (default 0.015).
- add_track(track: Track) None#
Add a track to a GenomeViewer instance
- Parameters:
track (tracks.track.Track) – Track object to be added
- add_tracks(tracks)#
Add tracks to a GenomeViewer instance
- Parameters:
tracks (tuple or list) – Objects of tracks.track.Track to be added
- plot(chromosome, start, end, fig_width=8, height_scale_factor=1, force_tight_layout=None, fig_height=None, **kwargs)#
Plot the genome viewer with the registered tracks.
- Parameters:
chromosome (str) – Chromosome/contig the region locates.
start (int) – Start of the genomic region, 0-based.
end (int) – End of the genomic region, 0-based.
fig_width (float, optional) – Width (in inches) of the figure. Default is 8.
height_scale_factor (float, optional) – Aspect ratio of the figure, so that
height_scale_factor*fig_widthgives the height of the figure. Default is 1.force_tight_layout (bool or None, optional) – If True, PyGV applies tight layout to the figure. Default is None.
fig_height (float or None, optional) – Height of the figure. If None, height will be the sum of tracks’ heights (in unit) *
height_scale_factor. Default is None.**kwargs (dict, optional) – Additional keyword arguments for track customization.
- Returns:
Axes for each track.
- Return type:
list of matplotlib.pyplot.Axes
- remove_track(track)#
Remove a track from a GenomeViewer instance
- Parameters:
track (tracks.track.Track) – Track object to be removed
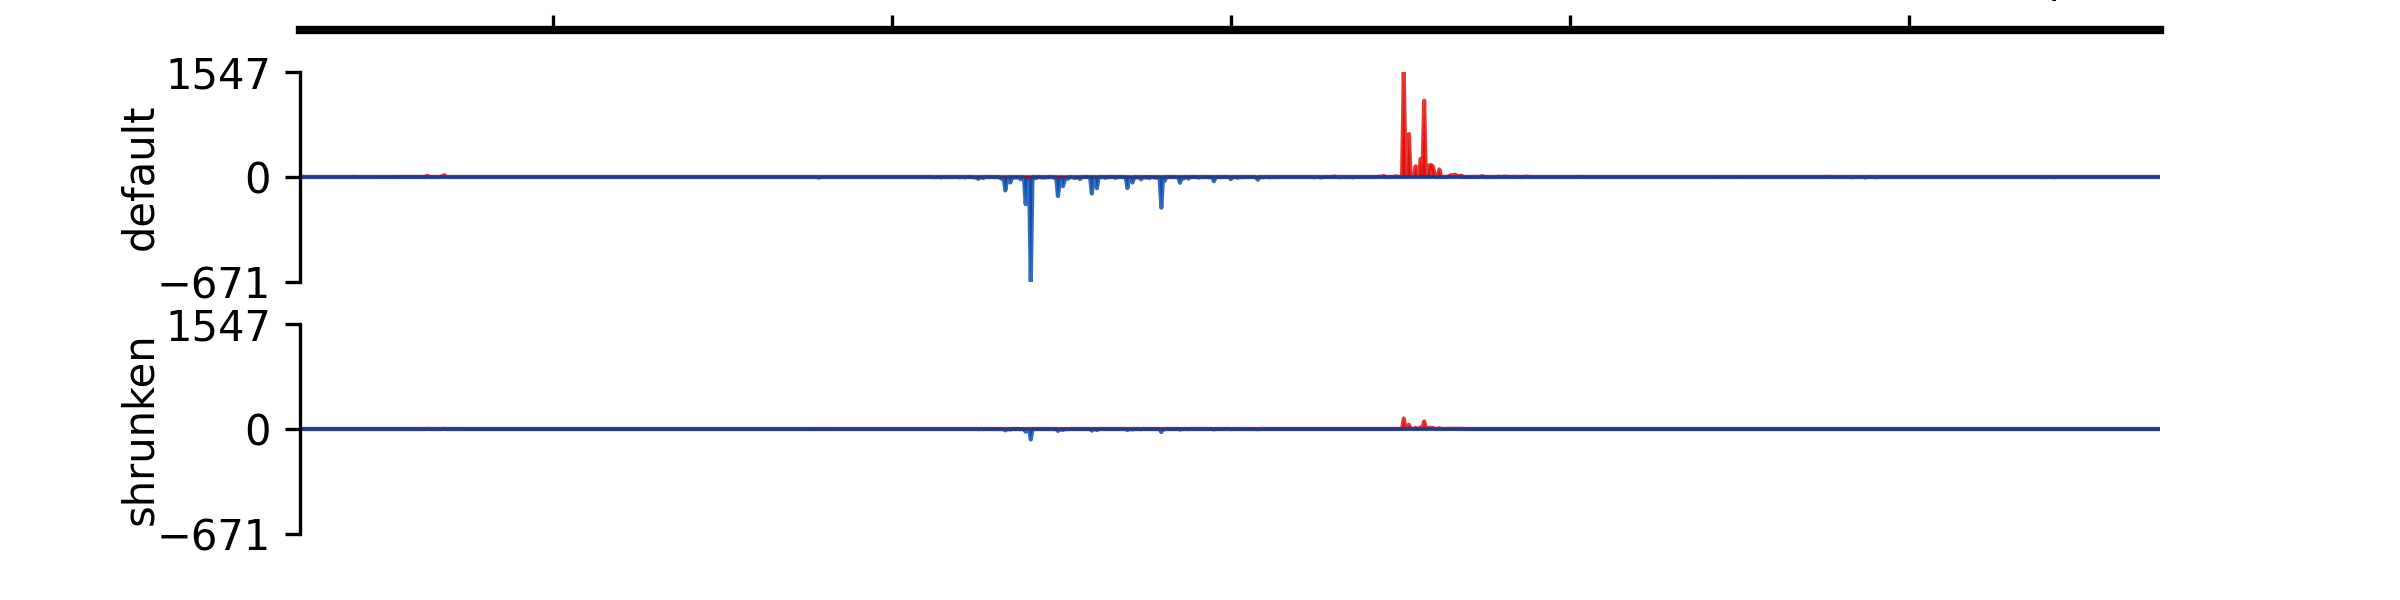
- reset_group_autoscale()#
Remove all group autoscale rules
- save(*args, **kwargs)#
Save figure to a file
- Parameters:
args
kwargs
- set_global_highlight_region(start: int, end: int, color='yellow', alpha=0.3)#
Set a global highlight region across all tracks, including the spaces between subplots.
- Parameters:
start (int) – Start position of the highlight region (genomic coordinate).
end (int) – End position of the highlight region (genomic coordinate).
color (str, optional) – Color of the highlight region. Default is “yellow”.
alpha (float, optional) – Transparency level of the highlight region. Default is 0.3.
- Return type:
None
- set_highlight_regions(starts: list | tuple, ends: list | tuple, colors=(), alpha_vals=())#
Set highlight regions for all tracks. If you only want to highlight regions on specific tracks, you can call each track’s
set_highlight_regions()method. Chromosome name is not needed for this method, it will use the same chromosome name when you call theplot()method.- Parameters:
starts (Union[list, tuple]) – Start positions
ends (Union[list, tuple]) – End positions
colors (tuple) – Leave it as an empty tuple if you want to use the default color. If you only give one color, it will be applied to all regions; otherwise, you should specify colors for each region.
alpha_vals (tuple) – Leave it as an empty tuple if you want to use the default transparency level (0.5). If you only give one value, it will be applied to all regions; otherwise, you should specify transparency values for each region.
Examples
(
Source code,png,pdf)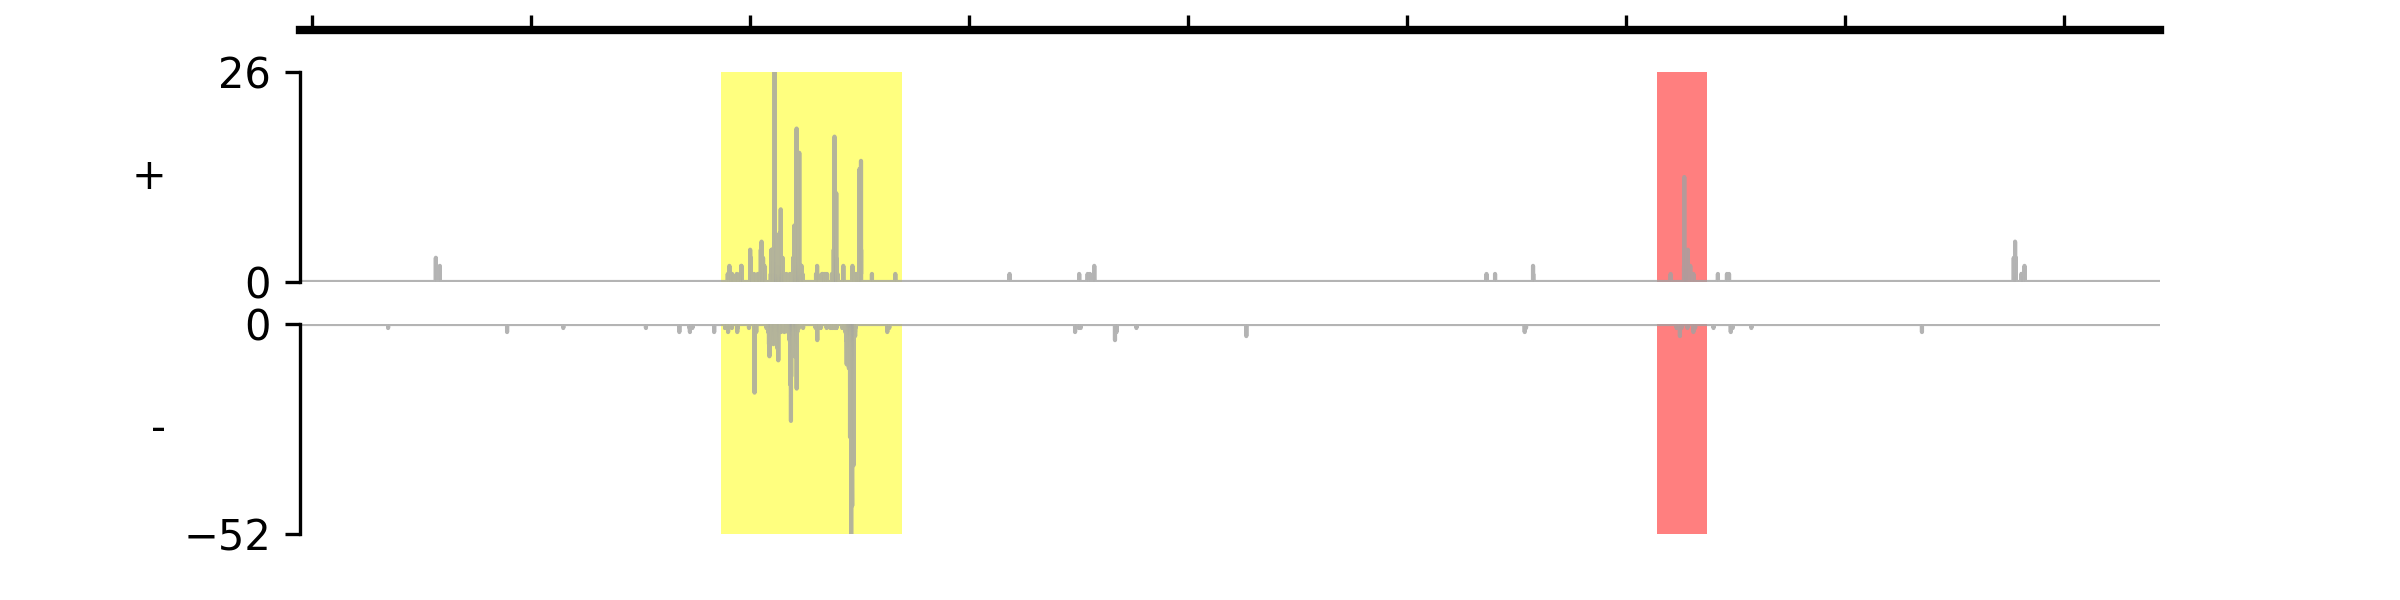
- show_tracks()#
Show all registered tracks
- Returns:
tracks – A list of registered tracks. Each element is also a list: name of the track, track type, track.
- Return type:
list