Basic tracks#
Abstract tracks#
- class pygv.tracks.track.Track(**kwargs: Any)#
Generic Track
- Parameters:
kwargs (dict) –
- namestr
Name of the track
- line_widthnumeric
The default width for lines
- heightint
Height of the track (unit, relative measurement)
- colorcolor_like
Default color, #A1A1A1
- edge_colorcolor_like
Edge color, #6E6E6E
- font_colorcolor_like
Font color, black
- alphafloat
Alpha of patches
- font_sizefloat
Font size
- y_tick_formatstr
String format for ticks on y-axis. For example: {:.1f} (only keep one digit)
- highlight_startint
Start loc of highlight region
- highlight_endint
End loc of highlight region
- highlight_colorcolor_like
Highlight color
- highlight_alphafloat
Alpha for highlighting
- y_label_rotationstr or float
Rotation of y-axis’ label, by default, vertical.
- y_label_hastr
Horizontal alignment about label for y-axis
- add_highlight_region(start, end)#
Set highlight region
- Parameters:
start (numeric) – Start position of the highlight zone
end (numeric) – End position of the highlight zone
- property alpha#
Alpha of patches
- property color#
Default color
- property edge_color#
Edge color
- property font_color#
Font color
- property font_size#
Font size
- property height#
Height of the track (unit, relative measurement)
- property inward_yticks#
Plot y-ticks strictly inside each track. If you want to apply inward_yticks to all tracks, you can set inward_yticks=True when creating the GenomeViewer, like GenomeViewer(inward_yticks=True)
Examples
(
Source code,png,pdf)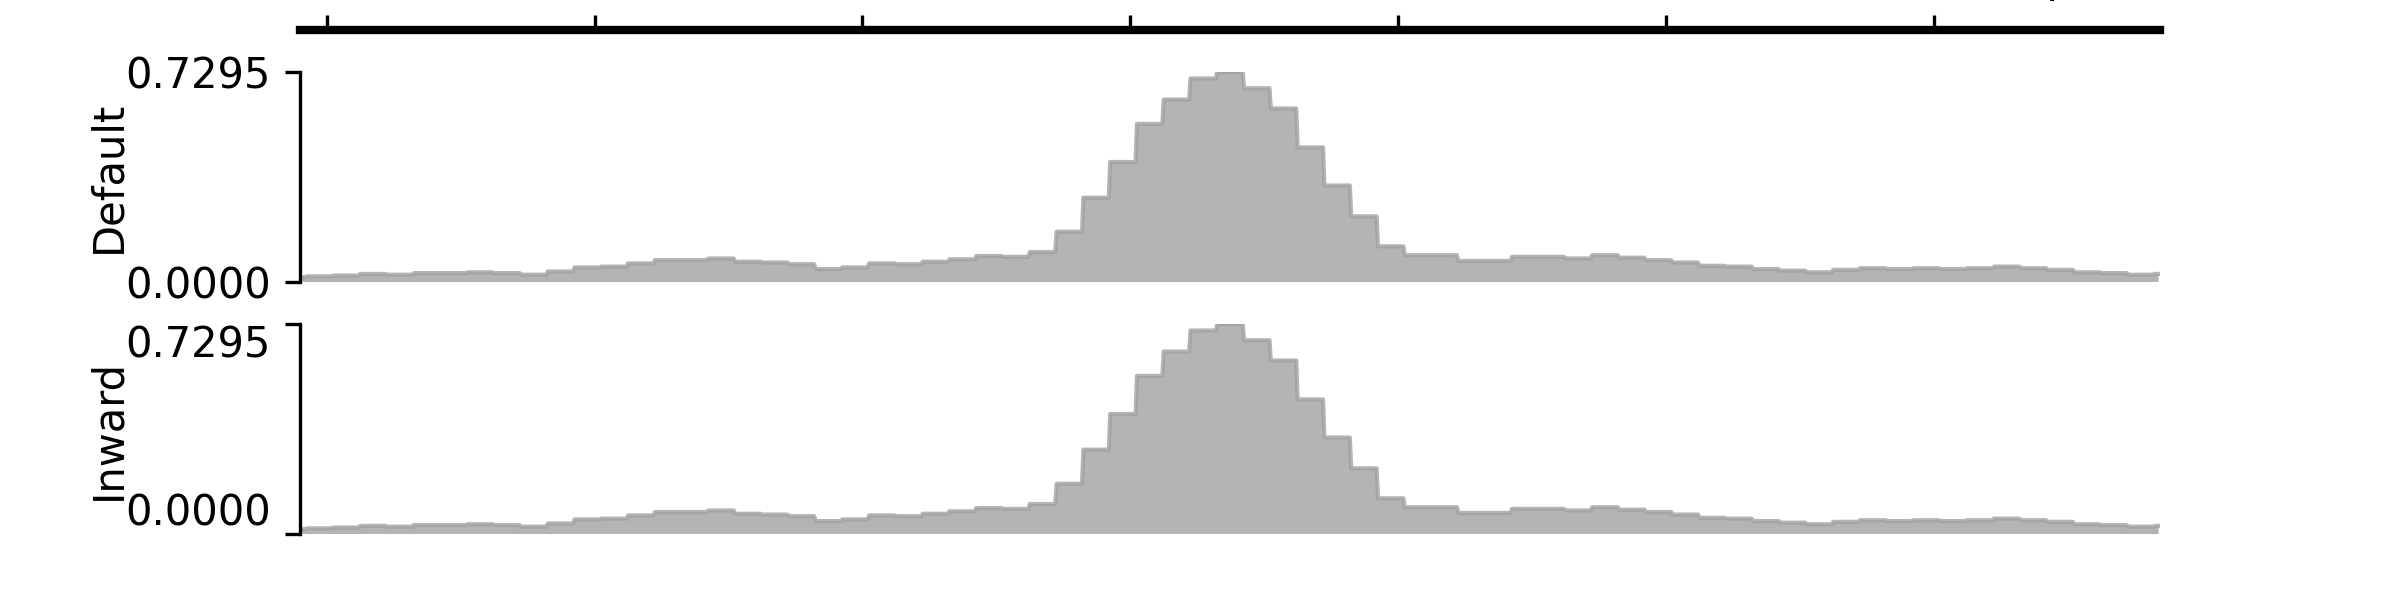
- property line_width#
Line width
- property name#
Name of the track
- remove_highlight()#
Remove highlight zone
- set_highlight_regions(starts, ends, colors=(), alpha_vals=())#
Set highlight region
- Parameters:
starts (list of numeric values) – Start positions of the highlight zones
ends (list of numeric values) – End positions of the highlight zones
colors (tuple) – Leave it as an empty tuple if you want to use the default color. If you only give one color, it will be applied to all regions; otherwise, you should specify colors for each region.
alpha_vals (tuple) – Leave it as an empty tuple if you want to use the default transparency level (0.5). If you only give one value, it will be applied to all regions; otherwise, you should specify transparency values for each region.
- property y_label_ha#
Set the horizontal alignment
- property y_label_rotation#
Rotation of y-axis’ label, by default, vertical.
- property y_label_va#
Set the vertical alignment
- property y_tick_format#
String format for ticks on y-axis
- class pygv.tracks.track.AnnotationTrack(track, **kwargs)#
Annotation track
- Parameters:
track (str)
kwargs (dict) –
- allowed_feature_lanesNone or int
- heightfloat
- arrow_interval :
- features_per_laneint
- font_box_alphafloat
- lane_spacefloat
- line_color :
- padding_leftint
- padding_rightint
padding_right- patch_heightint
- hide_visual_dupbool
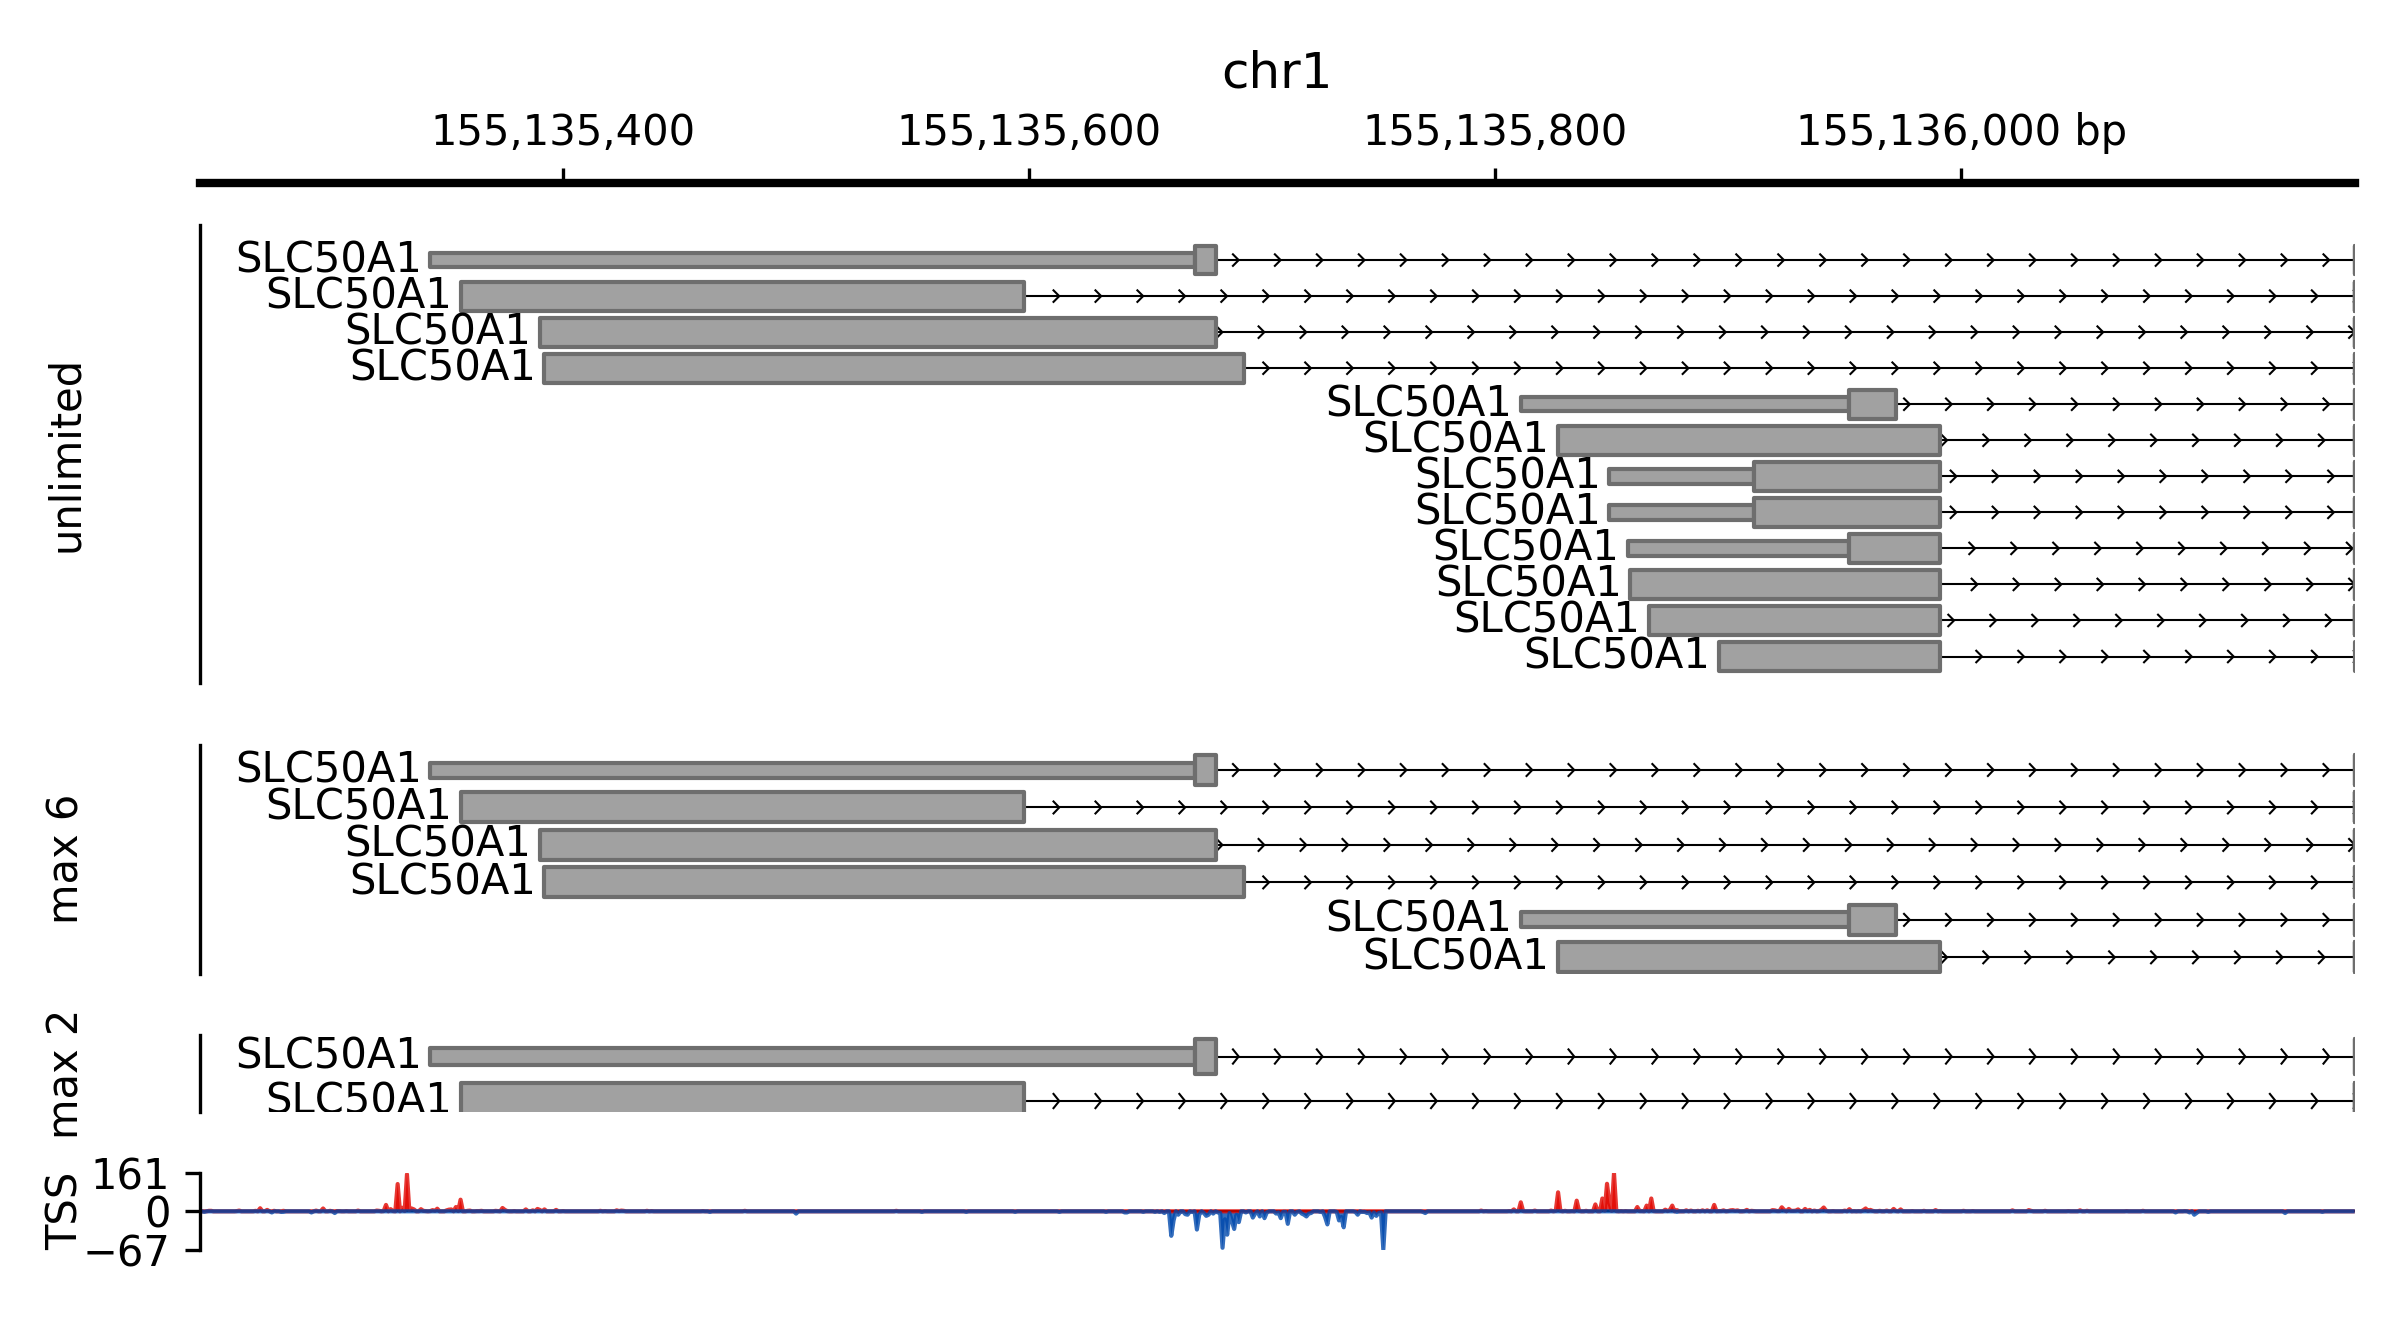
- property allowed_feature_lanes#
Max amount of feature lanes to be plotted. For example, if a region has 12 overlapping features, to make sure all features can be clearly rendered, these features will be plotted into 12 separate lanes. If you set the value to be smaller than 12 (say 2), then you will only see two lanes in the end.
Examples
(
Source code,png,pdf)
- property arrow_interval#
Intervals between arrows
- property features_per_lane#
Features per lane
- property font_box_alpha#
Transparent/alpha for text boxes labeling gene names
- property height#
Height of the track (unit, relative measurement)
- property hide_visual_dup#
Hide features which are “duplicates” to other features in current window (only one will be kept)
- property lane_space#
Extra spaces between lanes
- property line_color#
Line color
- property padding_left#
To ensure that feature names do not overlap with one another, you can introduce additional padding spaces on the left side of each feature. When setting an integer value (let’s call it \(x\)) for this property, features will be placed in separate lanes if the distance between them is less than x. Alternatively, if you opt for a float value between 0 and 1 (designated as \(f\)), the required spacing will be a fraction of the current visible region’s length (denoted as \(l\)), making the final spacing requirement equal to \(l\times f\).
- property patch_height#
Height of patches (for exons/blocks)
- property show_name#
By default, PyGV prints the names of genomic regions if available. This behavior can be changed by assigning
Falseto this property.
- class pygv.tracks.track.NumericalTrack(**kwargs)#
Numerical track
- Parameters:
kwargs (dict) –
- max_valint, optional
Maximum value to be plotted. By default, all signals are plotted.
- min_valint, optional
Minimum value to be plotted. By default, all signals are plotted.
- label_masked_peakbool
Whether or not to labelled capped signals.
- overflow_label_formatstr
String format for labeling overflow loci
- overflow_label_auto_adjustbool
Switch controlling the automatic placement of text labels for overflow signals
- property convert_nan_to_num#
Nan conversion
- property data_transform#
Function for data transformation, currently supported values:
None: no function will be called, return raw values
“asinh”: inverse hyperbolic sine function
“ln”: natural logarithm function (log base e)
“log2”: the binary logarithm function (log base 2)
“log10”: the common logarithmic function (log base 10)
“log1p”: the natural logarithm of one plus (ln(1+x))
function: a customized callable function
Note: If you add r at the beginning of log functions, values will be \(-f(-x)\)
Examples
(
Source code,png,pdf)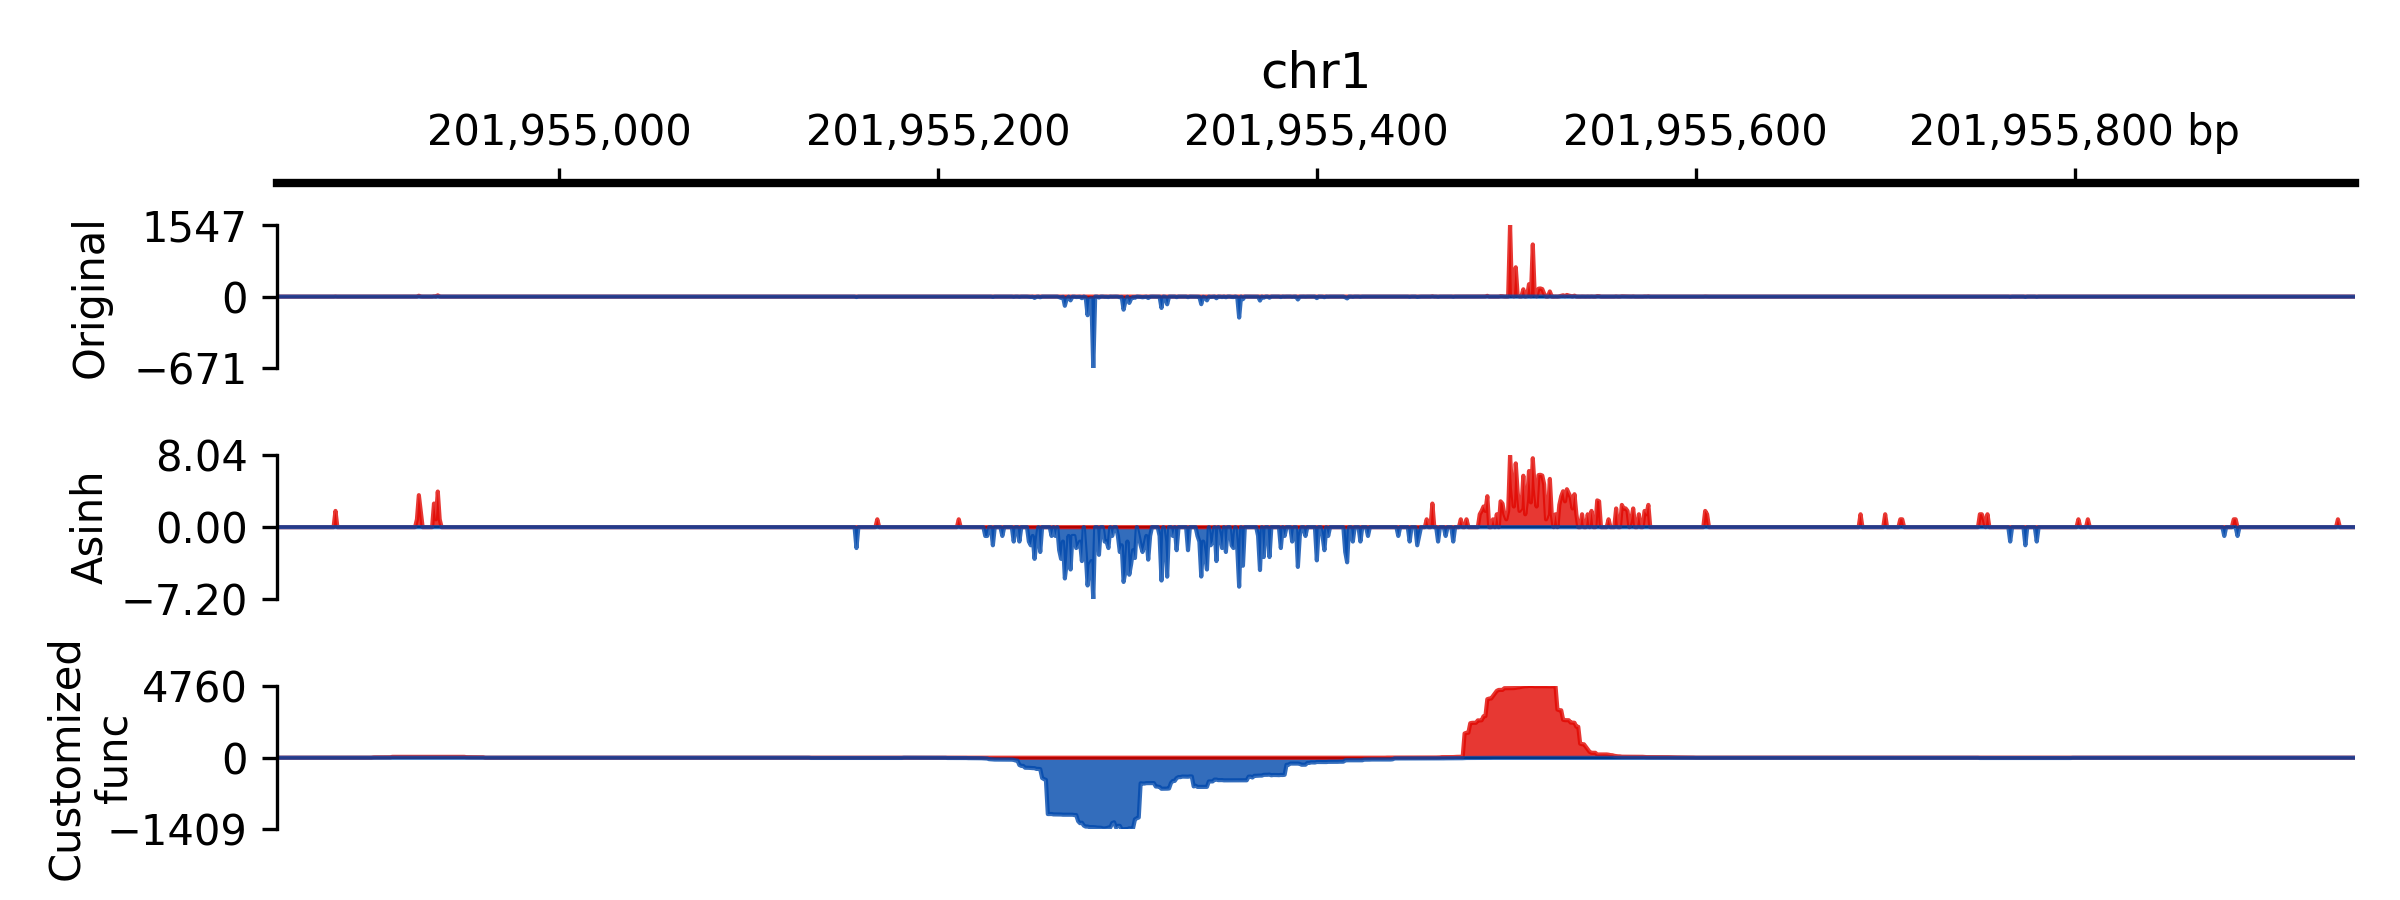
- property equal_space_for_pos_neg_ranges#
Set it as True to force data range to be independently
- property label_masked_peak#
If the signal values are capped, setting this value as True will write the original values near the cap signs.
- property max_val#
Max value for the y-axis. If the signal values are greater than min_val, they will be capped.
- property min_val#
Min value for the y-axis. If the signal values are smaller than min_val, they will be capped.
- property n_bins#
Number of bins to apply, if a positive number is set, the window will be separated in bins and stat method will be applied, default None (raw signals)
- property overflow_label_auto_adjust#
Switch controlling the automatic placement of text labels for overflow signals
- property overflow_label_format#
String format for labeling overflow loci
- reset_max_val()#
Remove constraints for max value
- reset_min_val()#
Remove constraints for min value
- property scale#
Normalization factors for signals, you can set this value to normalize densities by RPM, etc.
- property show_range#
Max value for the y-axis
- property stat_method#
Statistical method for binning windows