Tracks for numerical signals#
Dynamic values#
- class pygv.tracks.track.DynamicValueTrack(track: str = '', **kwargs)#
While other tracks load signal values from external files, DynamicValueTrack allows you to show the numerical values directly from your code. Track values should be assigned via the values property.
- Parameters:
track (str) – Placeholder
kwargs
- Raises:
ValueError will be raised if the len the values property is not equal to the span of plotting region as defined as end - start –
Examples
(
Source code,png,pdf)
bigWig#
- class pygv.tracks.bigwig_track.BigWigTrack(track: str, plot_type: str = 'line', **kwargs)#
Generic BigWig track
Examples
(
Source code,png,pdf)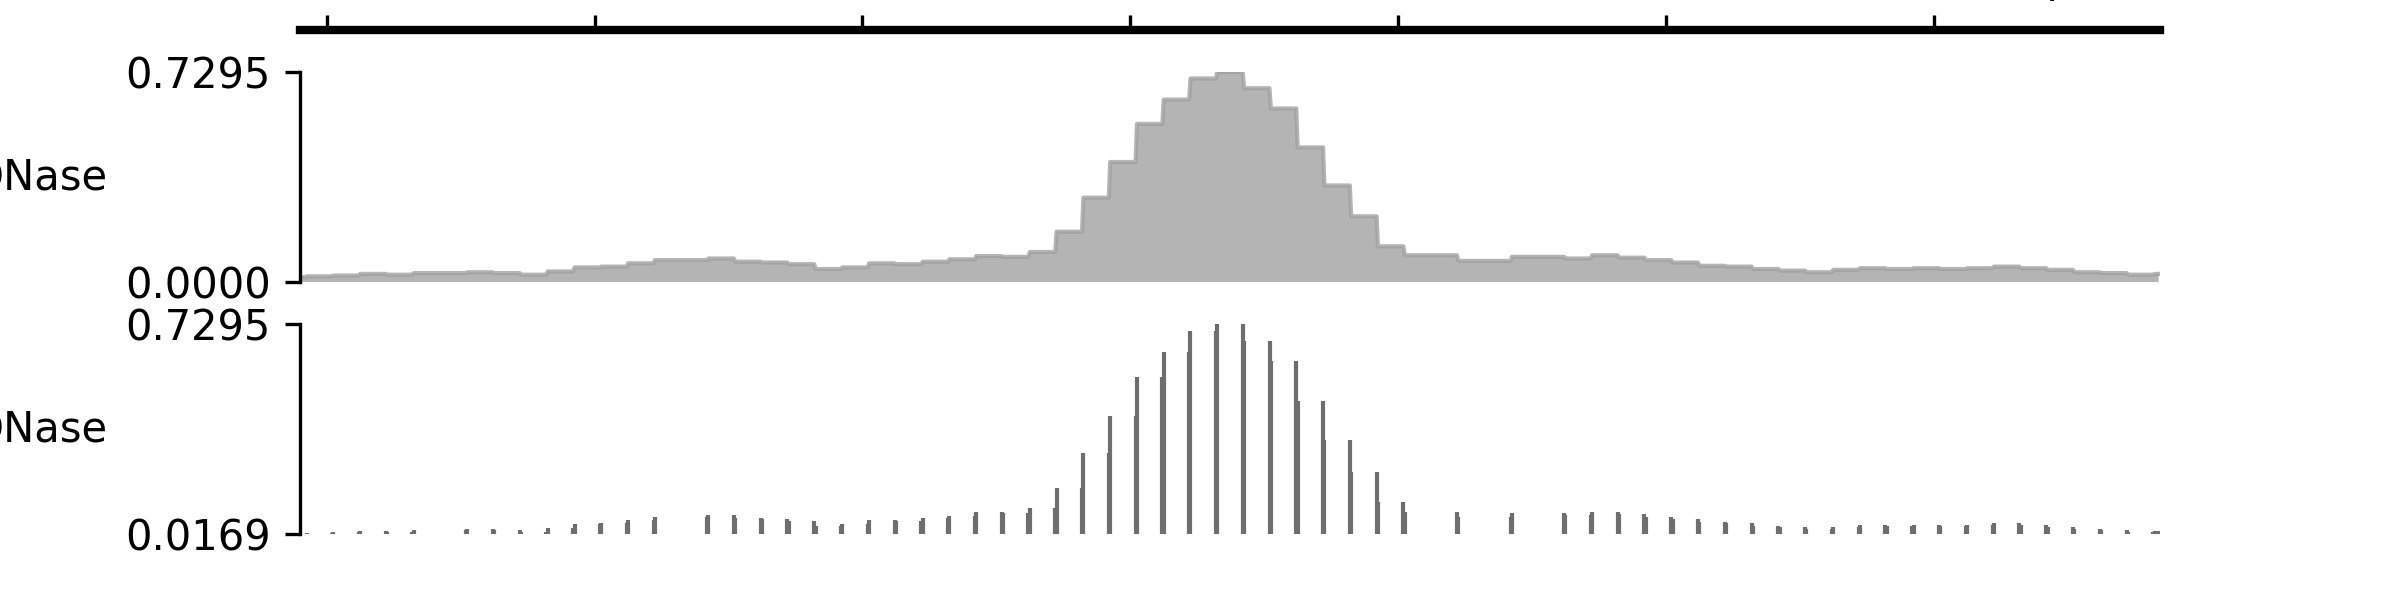
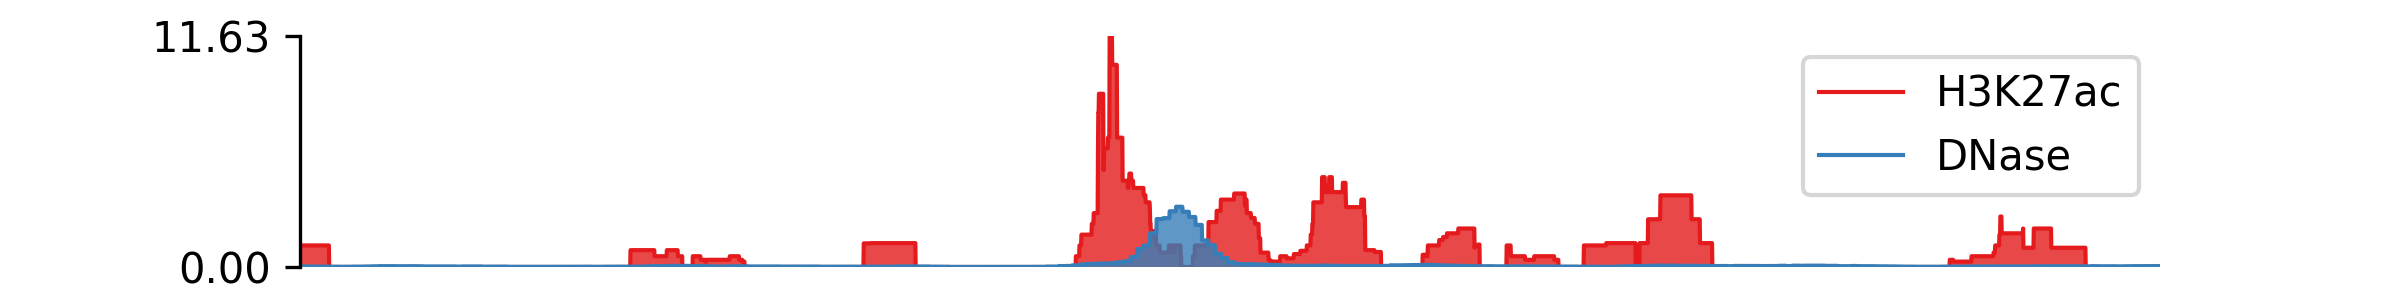
- class pygv.tracks.bigwig_track.OverlayingTrack(tracks, labels, palette='Set1', colors=None, legend=True, legend_kws=None, **kwargs)#
Overlay BigWig tracks (signals from multiple BigWig files in the same track) in a single track
- Parameters:
tracks (list of str or tuple[str, ...]) – List of file paths or urls. Tracks will be organized with ascending zorder.
labels (list of str or tuple[str, ...]) – Labels for each bigwig file
palette (str or palette instances) – Name of the palette you want to use. Matplot colormaps / seaborn palettes
colors (list of colors or None) – List of colors you want to use. If it’s None, then colors will be extracted from
palette.legend (bool) – Enable/disable legends
legend_kws (dict, optional) – Keyword arguments passed to matplotlib legend.
Examples
(
Source code,png,pdf)
- property colors#
Colors for each bigwig file
- property labels#
Labels for each bigwig file
- class pygv.tracks.bigwig_track.PairedStrandSpecificTrack(pl_track, mn_track, draw_y_independently=True, plot_type: str = 'line', **kwargs)#
Paired strand-specific tracks
- Parameters:
pl_track (str or list[str]) – File path(s) or url(s) for the positive track. When multiple tracks are provided, the mean values will be used.
mn_track (str or list[str]) – File path(s) or url(s) for the negative track. When multiple tracks are provided, the mean values will be used.
draw_y_independently (bool) – By default, True, which means the output track centers at zero and the positive and negatives axis have identical lengths regardless to their ranges. Set it as False if you want the y-axis to reflect the dominance of signals on a strand.
plot_type (str) – “line”: line plot “bar”: bar plot
pos_color (color_like) – Color for positive signals, by default, #E10600
neg_color (color_like) – Color for negative signals, by default, #0048AC
kwargs
Examples
(
Source code,png,pdf)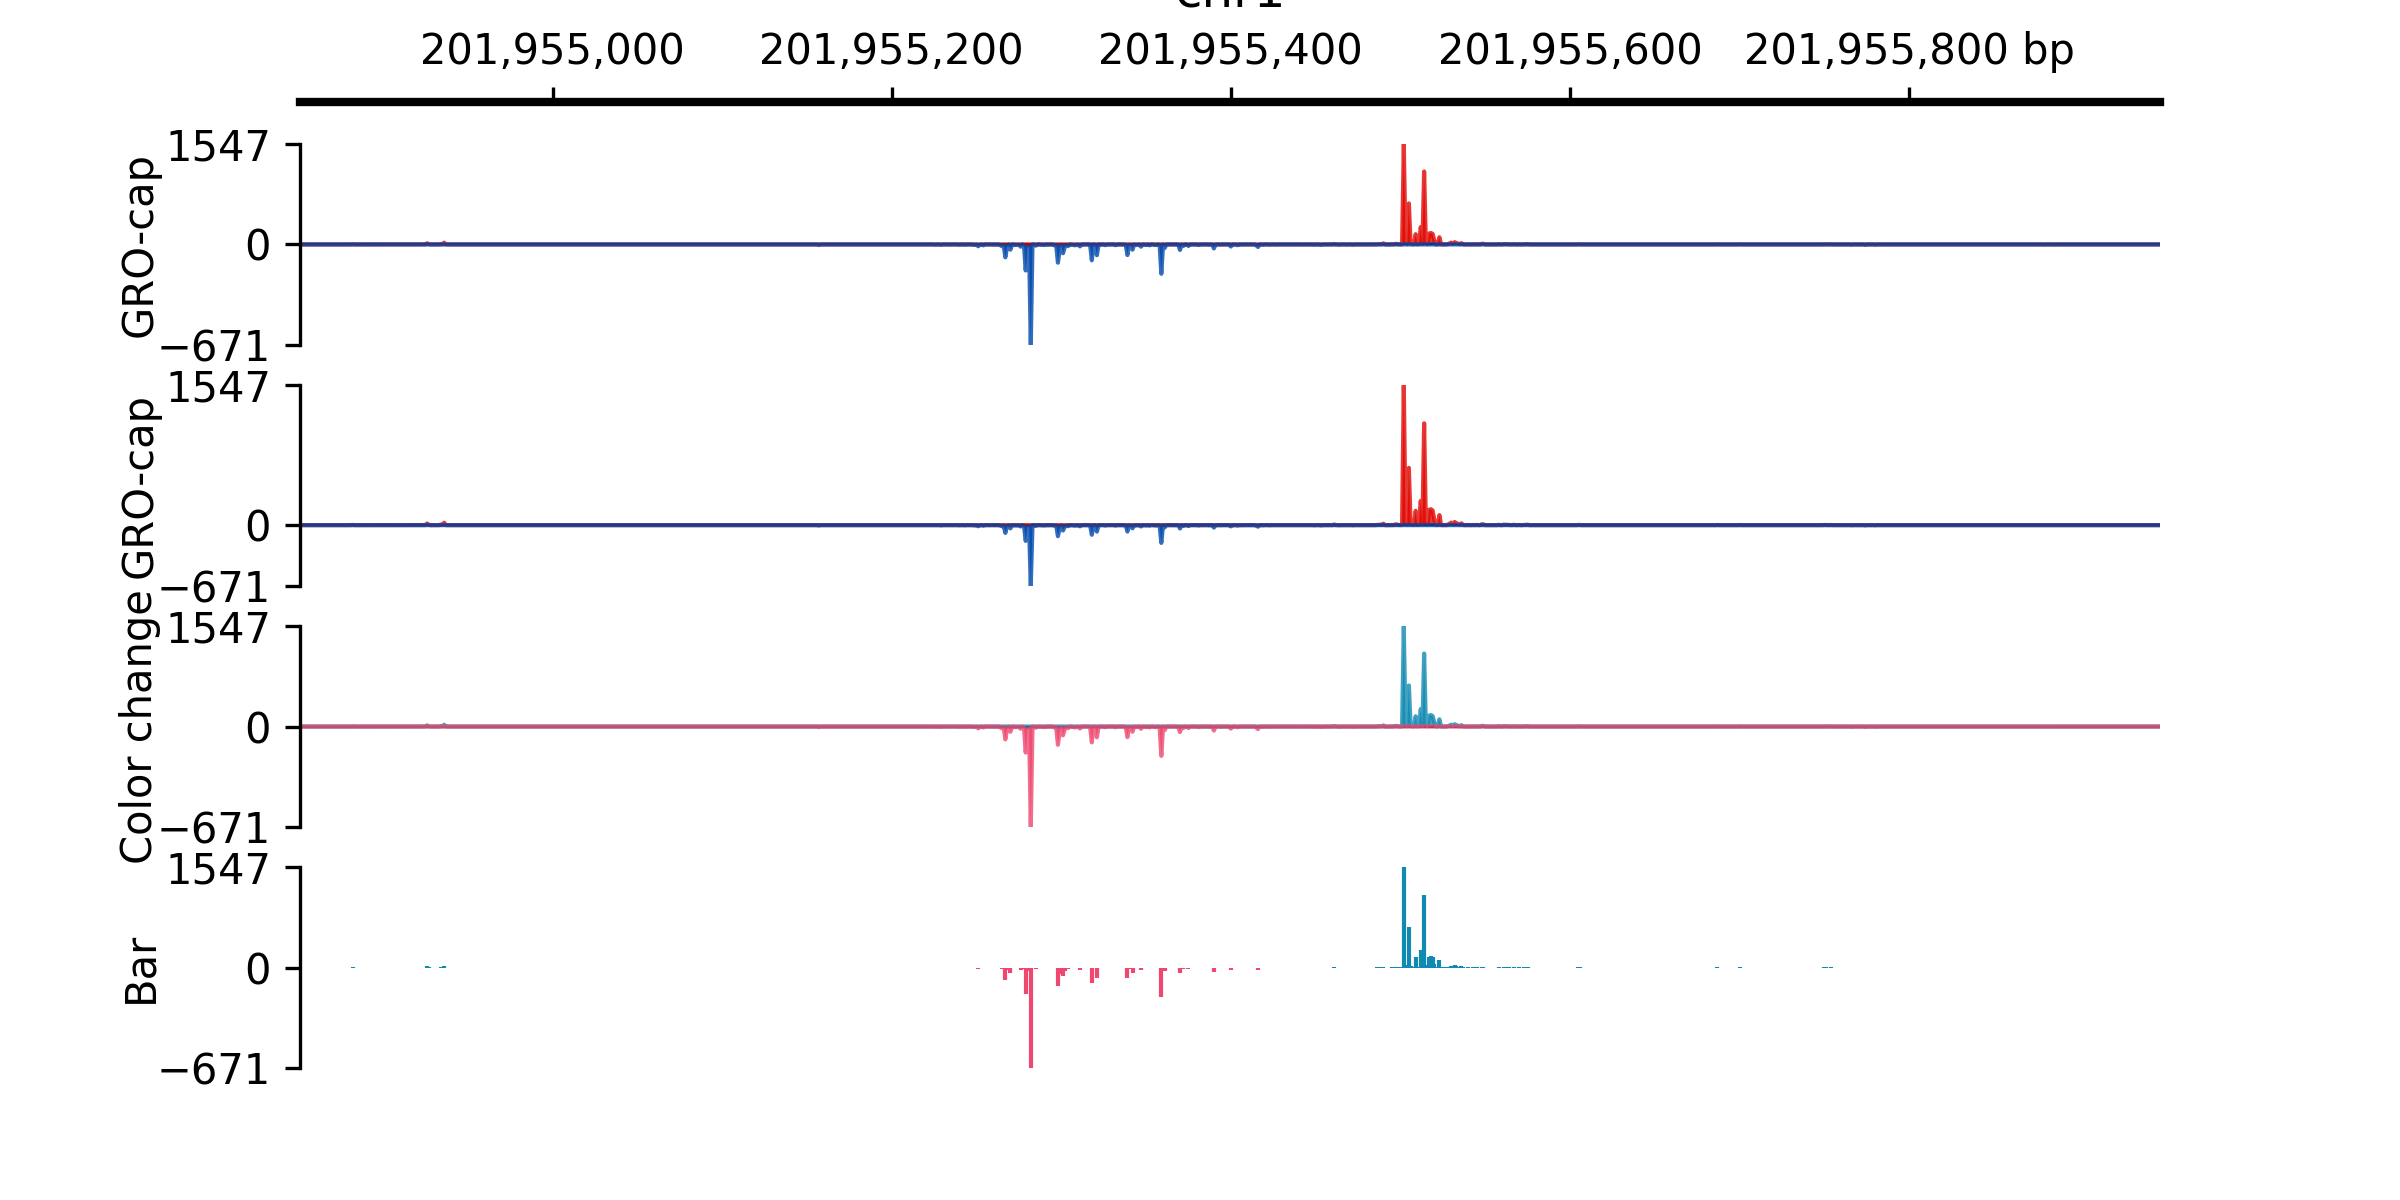
- property neg_color#
Color for negative signals
- property pos_color#
Color for negative signals
- class pygv.tracks.bigwig_track.PairedStrandSpecificTracks(pl_track, mn_track, draw_y_independently=True, plot_type: str = 'line', **kwargs)#
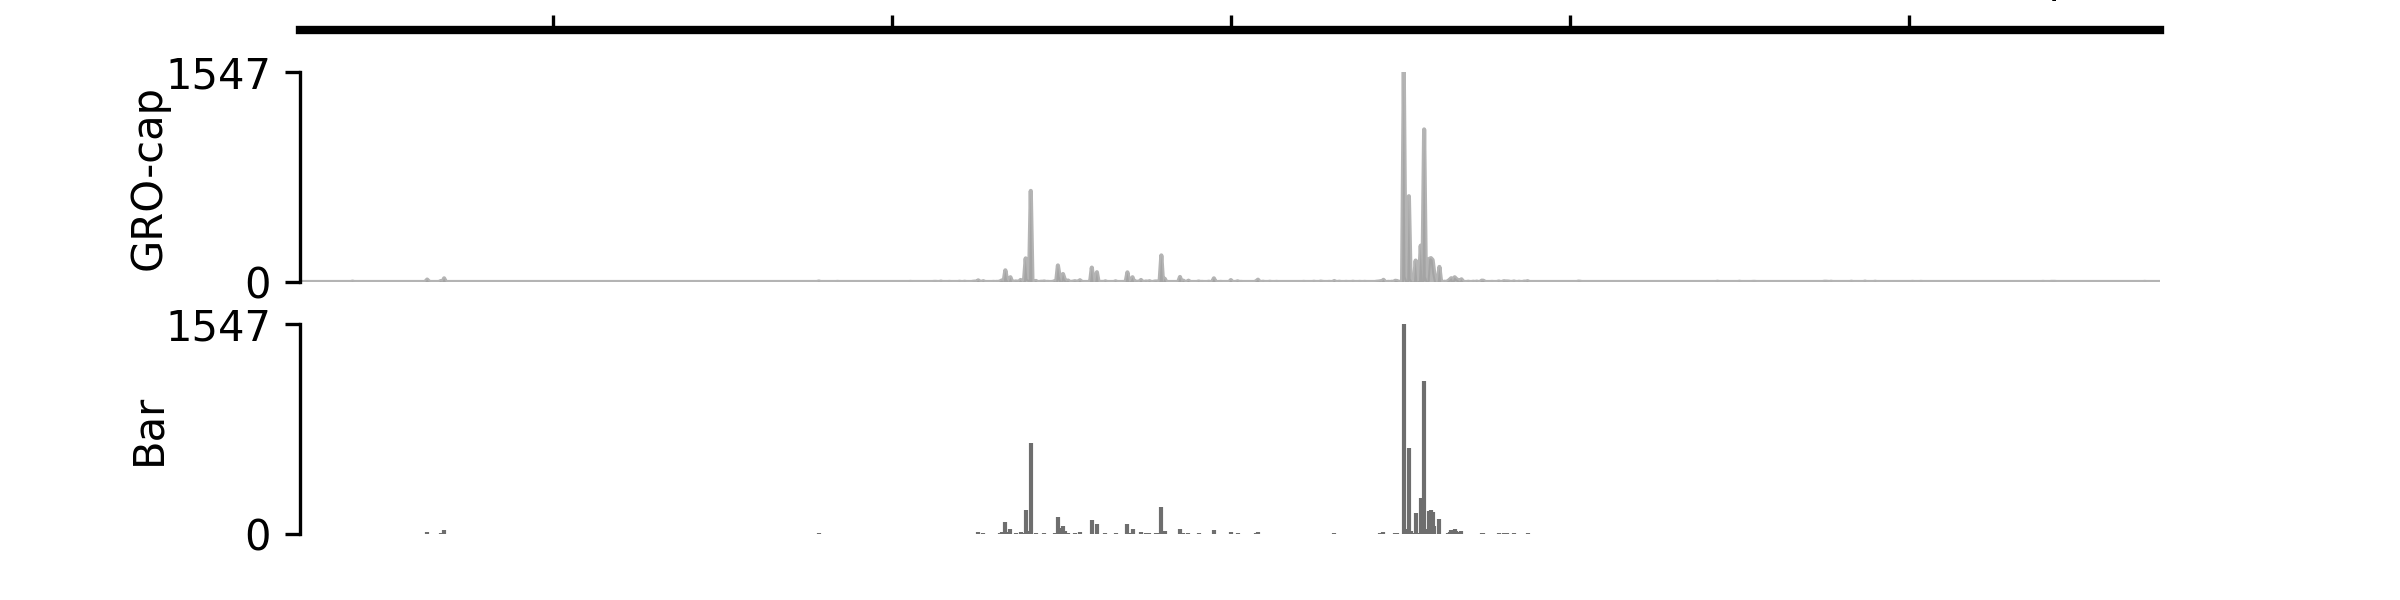
- class pygv.tracks.bigwig_track.PairedStrandlessTrack(pl_track, mn_track, plot_type: str = 'line', **kwargs)#
Paired strandless tracks
- Parameters:
pl_track (str or list[str]) – File path(s) or url(s) for the positive track. When multiple tracks are provided, the mean values will be used.
mn_track (str or list[str]) – File path(s) or url(s) for the negative track. When multiple tracks are provided, the mean values will be used.
plot_type (str) – “line”: line plot “bar”: bar plot
kwargs
Examples
(
Source code,png,pdf)