Tracks for genome annotations#
BED-like#
If you want to plot interactions and paired-end data, consider use BedPETrack or ConnectionArcTrack in PyGV.
- class pygv.tracks.bed_track.BedTrack(track, **kwargs: Any)#
If you’re looking to visualize genomic features like genes and regulatory elements, you can utilize the
BedTrackin PyGV. If you desire greater control over the specific features to be plotted, such as filtering features by names, gene IDs, or transcript IDs, then theGtfTrackmay be the preferred choice.- Parameters:
track (str) –
Path to the input bed file. Index from tabix is optional, but when index presents, drawing will be much faster and less memory intensive. PyGV’s BedTrack implementation supports the visualization of genomic features encoded in four BED variations:
Bed3: includes three columns: chromosome, start, and end.
Bed4: includes three columns: chromosome, start, end, and name.
Bed8: extends Bed3 with additional columns for name, score, strand, thickStart, and thickEnd.
Bed12: the most comprehensive, includes columns for itemRgb, blockCount, blockSizes, and blockStarts in addition to those found in Bed8.
kwargs (Any) –
- heightfloat
Height of each feature lane. If you have four feature lanes, and the height value is set as 0.25, then the final track will have identical overall height as other tracks. If you have multiple
BedTrackor other kind ofAnnotationTrack, you can set the same height values to all these tracks, which makes sure all tracks have consistent appearances (which is also the default behavior).- allowed_feature_lanesOptional[int]
- plot_thicknessbool
See
plot_thickness- padding_leftint or float
See
padding_left- namestr
Track name.
name- show_namebool
Show feature names. See
show_name
More kwargs can be seen here:
AnnotationTrack
Examples
(
Source code,png,pdf)
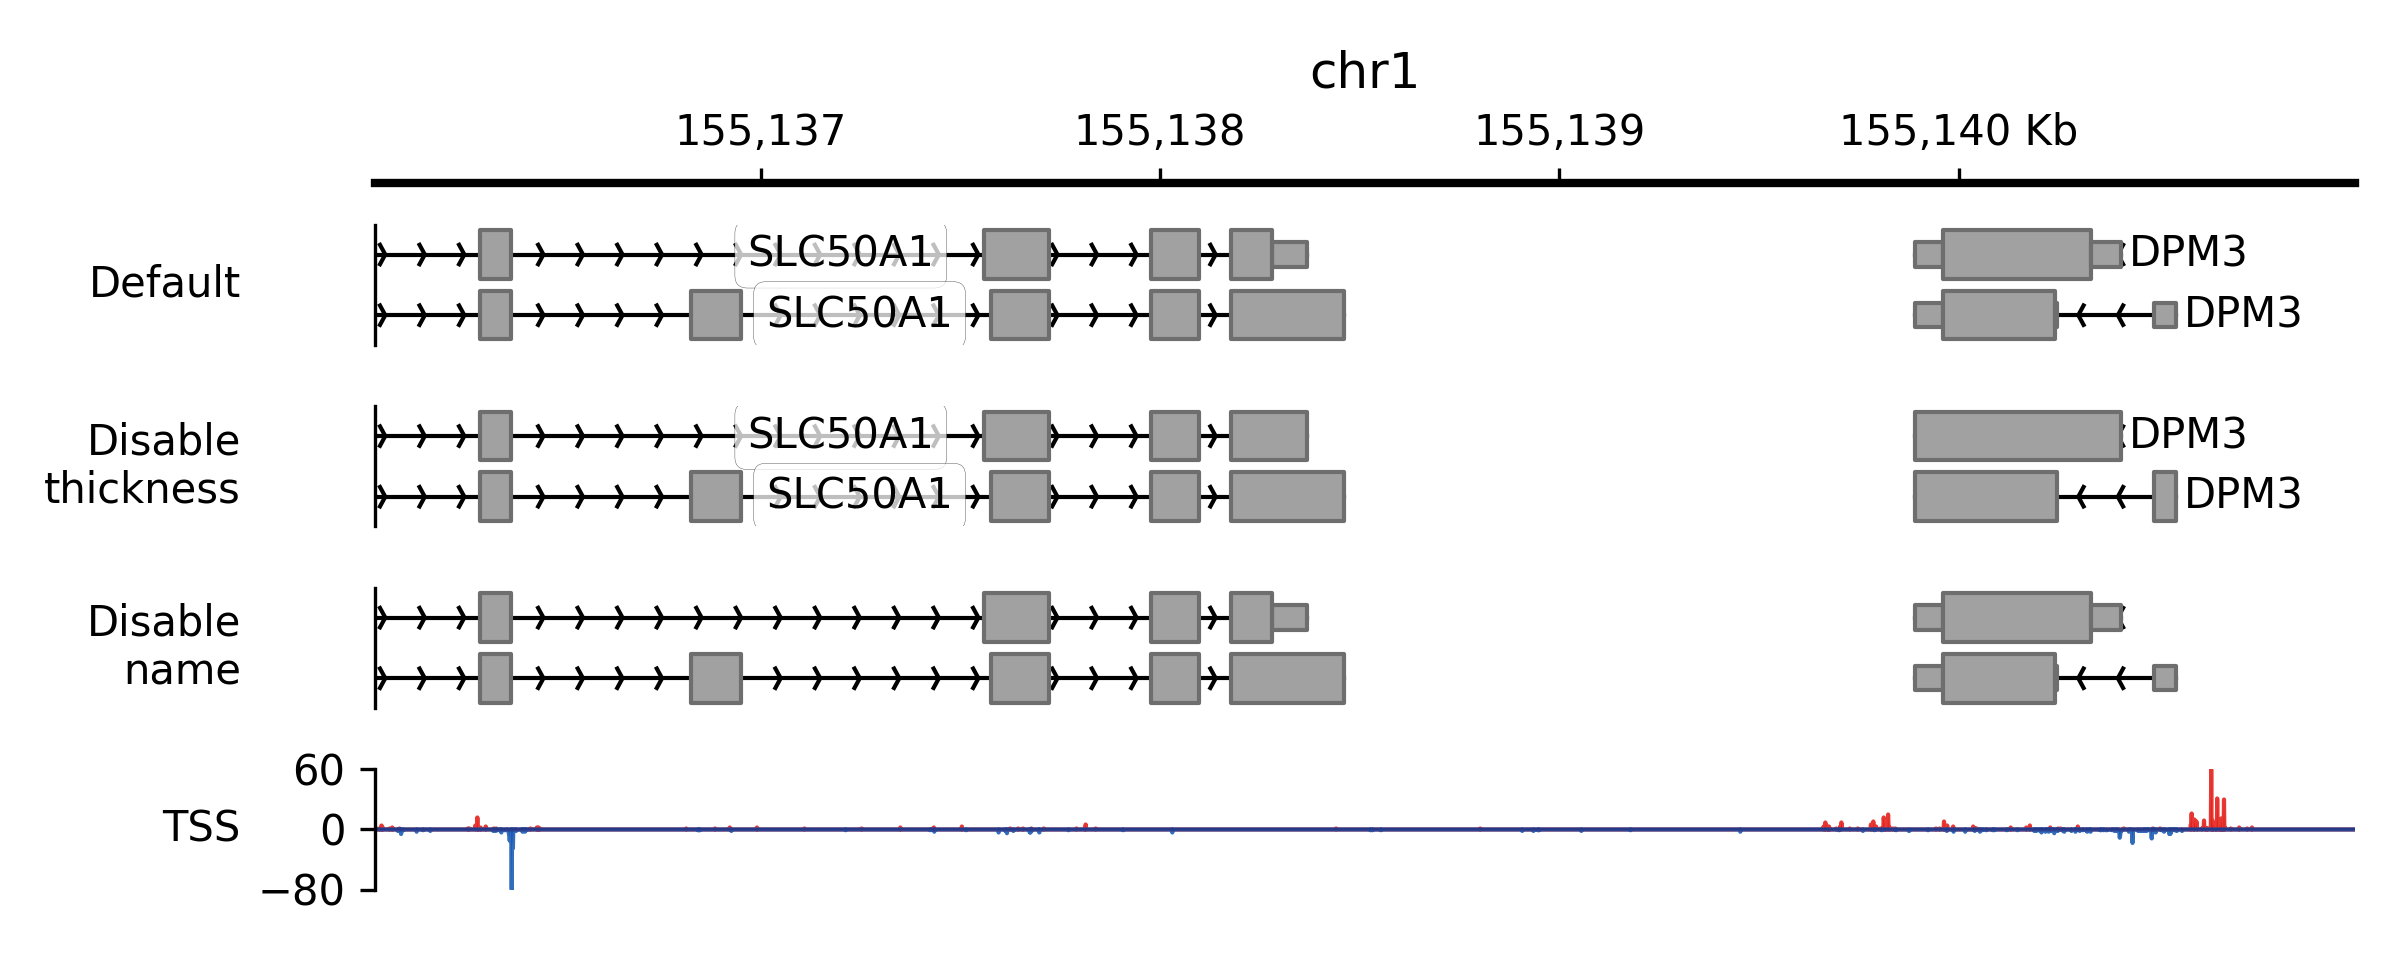
- property plot_thickness#
When valid starting (thickStart) and ending (thickEnd) positions are provided for a feature, as observed, for instance, in the region between the start and stop codon within gene displays, this specific region will be illustrated with a thicker line. In situations where there is no valid thick section, whether due to the absence of thickStart and thickEnd positions (as in the case of providing a bed3 file) or when the length of the feature is less than 1, the
plot_thicknessproperty will be automatically set toFalse.
- property show_mode#
Collapse overlapping features (collapsed) or keep them separately (expanded) for plotting.
- property block_line_width#
Line/edge width for blocks.
- class pygv.tracks.bed_track.BedPETrack(track, **kwargs: Any)#
If you’re looking to visualize genomic interactions like proximity captured by Hi-C, you can utilize the
BedPETrackin PyGV.- Parameters:
track (str) – Path to the input BEDPE file. Index from tabix is optional, but when index presents, drawing will be much faster and less memory intensive. Only the first six columns in the file will be used (chromosome, start, and end for the two anchors)
kwargs (dict) –
- namestr
Track name.
name- show_namebool
Show feature names. See
show_name- flipbool
Flip the arcs vertically
- highlight_linkslist or tuple
Links to highlight. Each item can be either a BEDPE name string or a coordinate tuple/list of (chromosome, start1, end1, start2, end2).
- highlight_link_colorcolor_like
Color used for highlighted links.
- highlight_link_alphafloat
Alpha used for highlighted links.
- highlight_link_line_widthfloat
Line width used for highlighted links.
More kwargs can be seen here:
AnnotationTrack
Examples
(
Source code,png,pdf)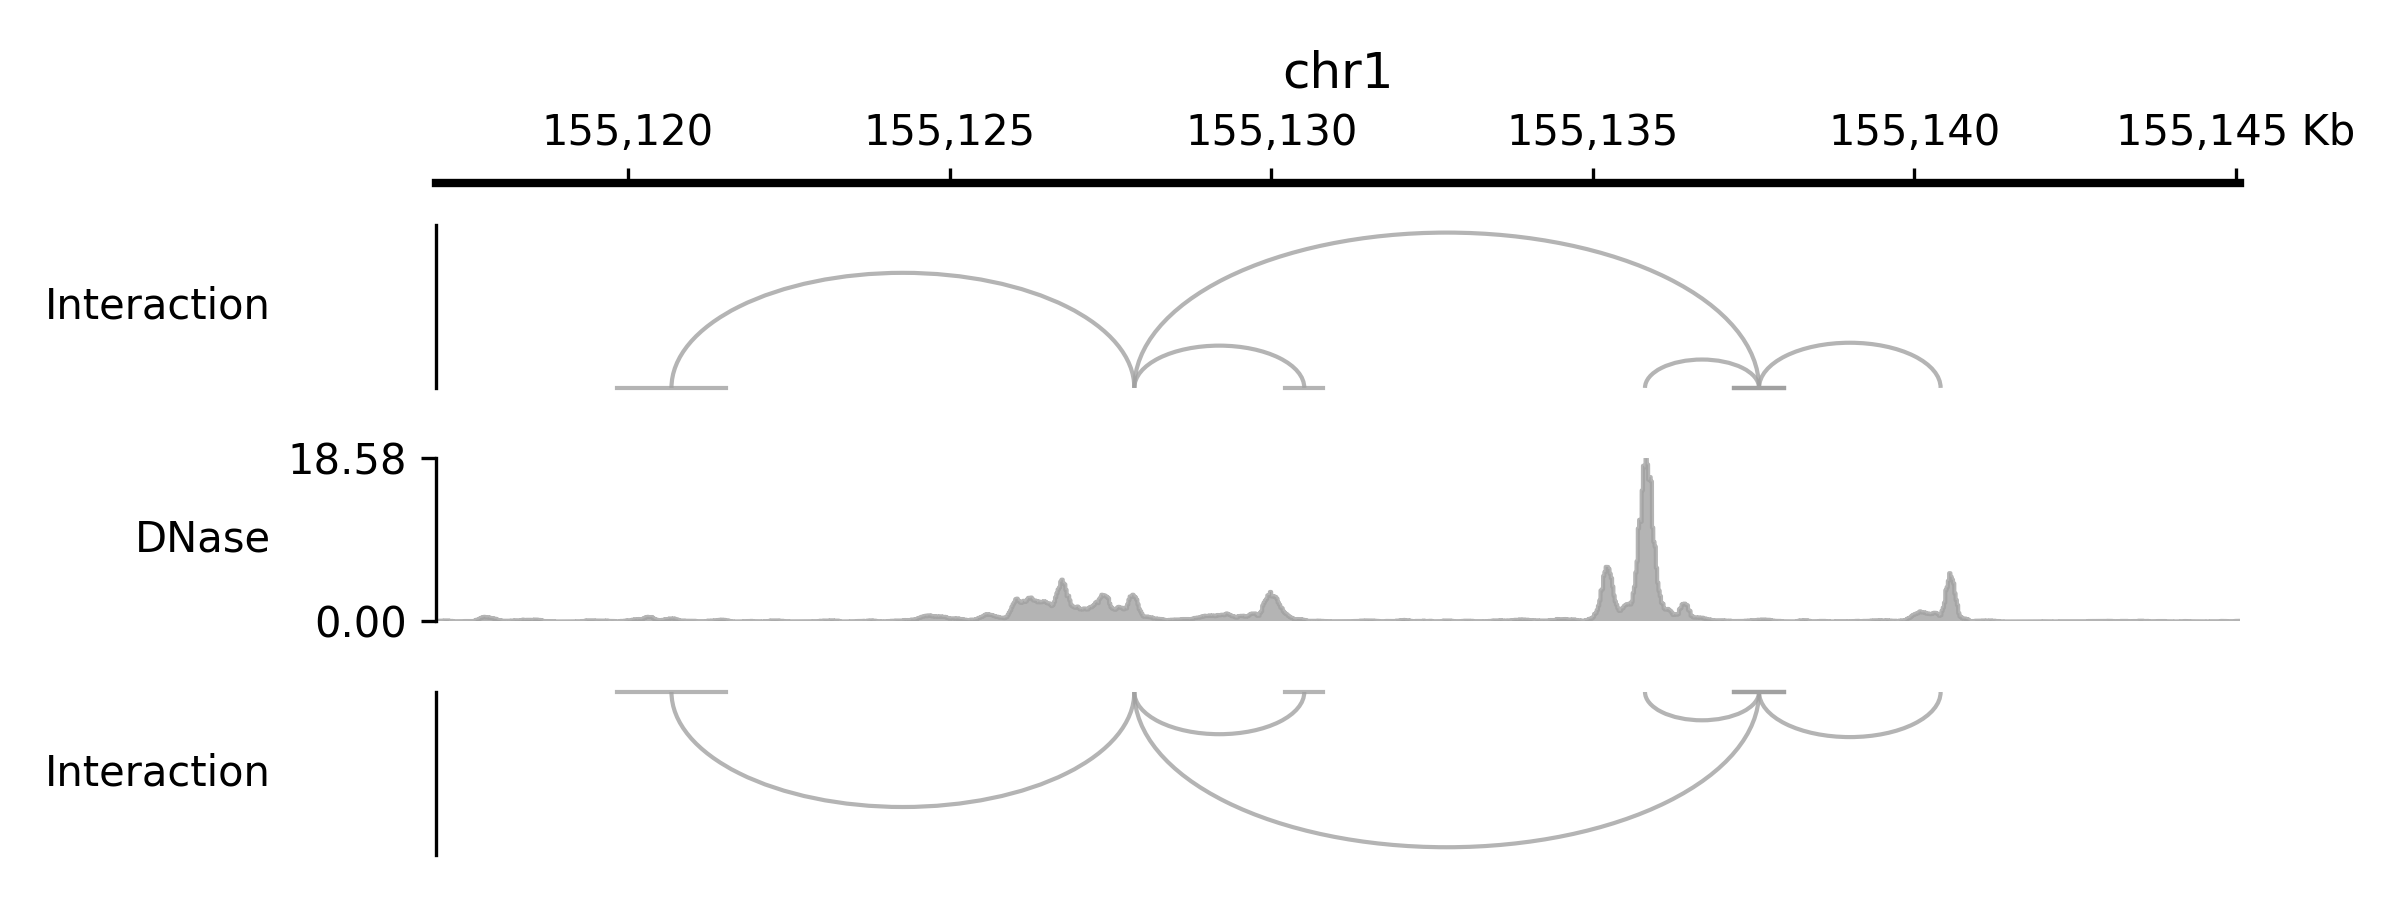
- set_highlight_links(links)#
Set highlighted links for this BEDPE track.
- Parameters:
links (str or iterable) – A BEDPE name, or an iterable of names and/or coordinate tuples (chromosome, start1, end1, start2, end2).
- add_highlight_link(link)#
Add one highlighted link by BEDPE name or anchor coordinates.
- clear_highlight_links()#
Remove all highlighted links.
- class pygv.tracks.bed_track.ConnectionArcTrack(track, **kwargs)#
Similar to
BedPETrack,ConnectionArcTrackcan be used to visualize genomic interactions like enhancer-promoter interaction. The main difference between these two tracks is thatConnectionArcTrackdraws a directed arrow from the source to the target.- Parameters:
track (str) – Path to the input BEDPE file. Index from tabix is optional, but when index presents, drawing will be much faster and less memory intensive. Only the first six columns in the file will be used (chromosome, start, and end for the two anchors)
kwargs (dict) –
- namestr
Track name.
name- show_namebool
Show feature names. See
show_name- flipbool
Flip the arcs vertically
More kwargs can be seen here:
AnnotationTrack
Examples
(
Source code,png,pdf)
bigBed#
- class pygv.tracks.bigbed_track.BigBed6Track(track, **kwargs)#
Standard BigBed6 track
- Parameters:
track (str) – File path or url to a bigBed file
kwargs (dict) – The same as
pygv.tracks.track.AnnotationTrack
Examples
(
Source code,png,pdf)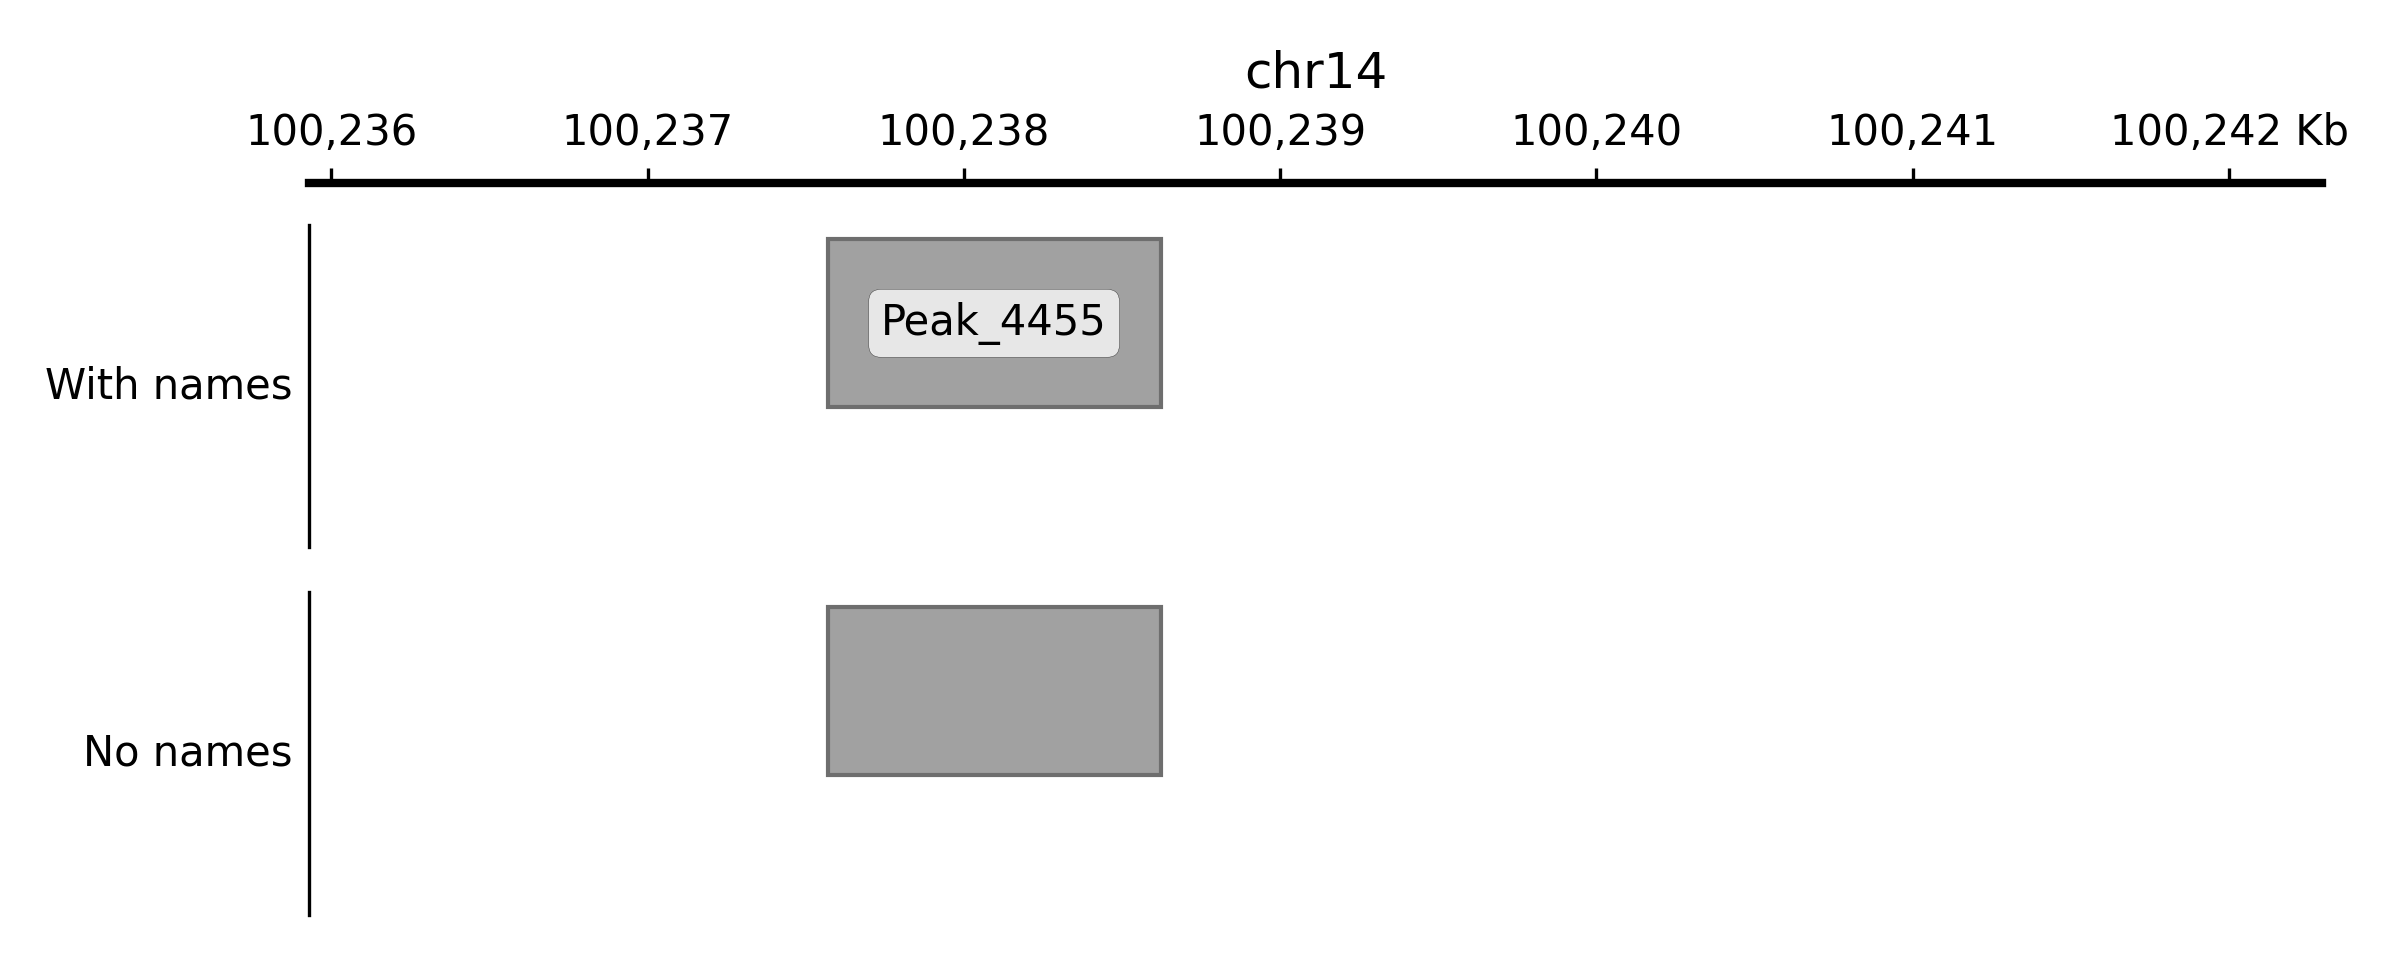
- get_filters()#
Return filters
- set_filters(key, value)#
Set filter, records with matching names will be labeled
- Parameters:
key (str) – Currently, only name is supported
value (str)
- class pygv.tracks.bigbed_track.UCSCMutationTrack(track, **kwargs)#
Lollipop plot from UCSC-style mutational bigwig files
- Parameters:
track
kwargs –
- line_colorcolor_like
- apply_color_gradientbool
- color_mapstr or matplotlib.pyplot.cm
- property apply_color_gradient#
Set it to True to apply color gradient to marks, by default, False
- property color_map#
Color map for markers
- get_filters()#
Return filters
- property line_color#
Line color, by default, red
- set_filters(key, value)#
Set filter, records matching filters will be labeled in the track
- Parameters:
key (str) – Only “MAF” and “ID” are supported currently
value (numeric) – min value
GTF/GFF#
- class pygv.tracks.gtf_track.GtfTrack(track, filters=None, show_genes=False, annotation_formatter=None, **kwargs)#
Gtf track
- Parameters:
track (str)
kwargs (dict) – The same as
pygv.tracks.track.AnnotationTrack
- property filters#
Filters, a callable object which returns True/False to keep/discard gtf records. Set as None to disable this function.
- property show_transcript_id#
Filters, a callable object which returns True/False to keep/discard gtf records. Set as None to disable this function.