Tracks for Sequences#
Sequence Logo#
- class pygv.tracks.logo_track.DynseqTrack(track: str = '', seq_fasta: str = '', is_nucleotide: bool = True, **kwargs)#
Dynseq-flavor sequence logo track. The implementation is built on the top of logomaker. After creating the track object, logo matrix should be assigned using
values.- Parameters:
track (str or list[str]) – track file(s)
seq_fasta (str) – Genome fasta file
is_nucleotide (bool) – Whether the track is a nucleotide track
kwargs –
- color_scheme(str, dict, or array with length 3)
Specification of logo colors. Default is ‘gray’. Can take a variety of forms.
(str) A built-in Logomaker color scheme in which the color of each
- character is determined that character’s identity. Options are,
For DNA/RNA: ‘classic’, ‘grays’, or ‘base_paring’.
For protein: ‘hydrophobicity’, ‘chemistry’, or ‘charge’.
(str) A built-in matplotlib color name such as ‘k’ or ‘tomato’
(list) An RGB array, i.e., 3 floats with values in the interval [0,1]
- (dict) A dictionary that maps characters to colors, E.g.,
- {‘A’: ‘blue’,
’C’: ‘yellow’, ‘G’: ‘green’, ‘T’: ‘red’}
- font_name: (str)
The character font to use when rendering the logo. For a list of valid font names, run logomaker.list_font_names().
- stack_order: (str)
Must be ‘big_on_top’, ‘small_on_top’, or ‘fixed’. If ‘big_on_top’, stack characters away from x-axis in order of increasing absolute value. If ‘small_on_top’, stack glyphs away from x-axis in order of decreasing absolute value. If ‘fixed’, stack glyphs from top to bottom in the order that characters appear in the data frame.
- center_values: (bool)
If True, the stack of characters at each position will be centered around zero. This is accomplished by subtracting the mean value in each row of the matrix from each element in that row.
- flip_below: (bool)
If True, characters below the x-axis (which correspond to negative values in the matrix) will be flipped upside down.
- shade_below: (float in [0,1])
The amount of shading to use for characters drawn below the x-axis. Larger numbers correspond to more shading (i.e., darker characters).
- fade_below: (float in [0,1])
The amount of fading to use for characters drawn below the x-axis. Larger numbers correspond to more fading (i.e., more transparent characters).
- fade_probabilities: (bool)
If True, the characters in each stack will be assigned an alpha value equal to their height. This option only makes sense if df is a probability matrix. For additional customization, use Logo.fade_glyphs_in_probability_logo().
- Raises:
ValueError will be raised if the len the values property is not equal to the span of plotting region as defined as end - start –
Examples
(
Source code,png,pdf)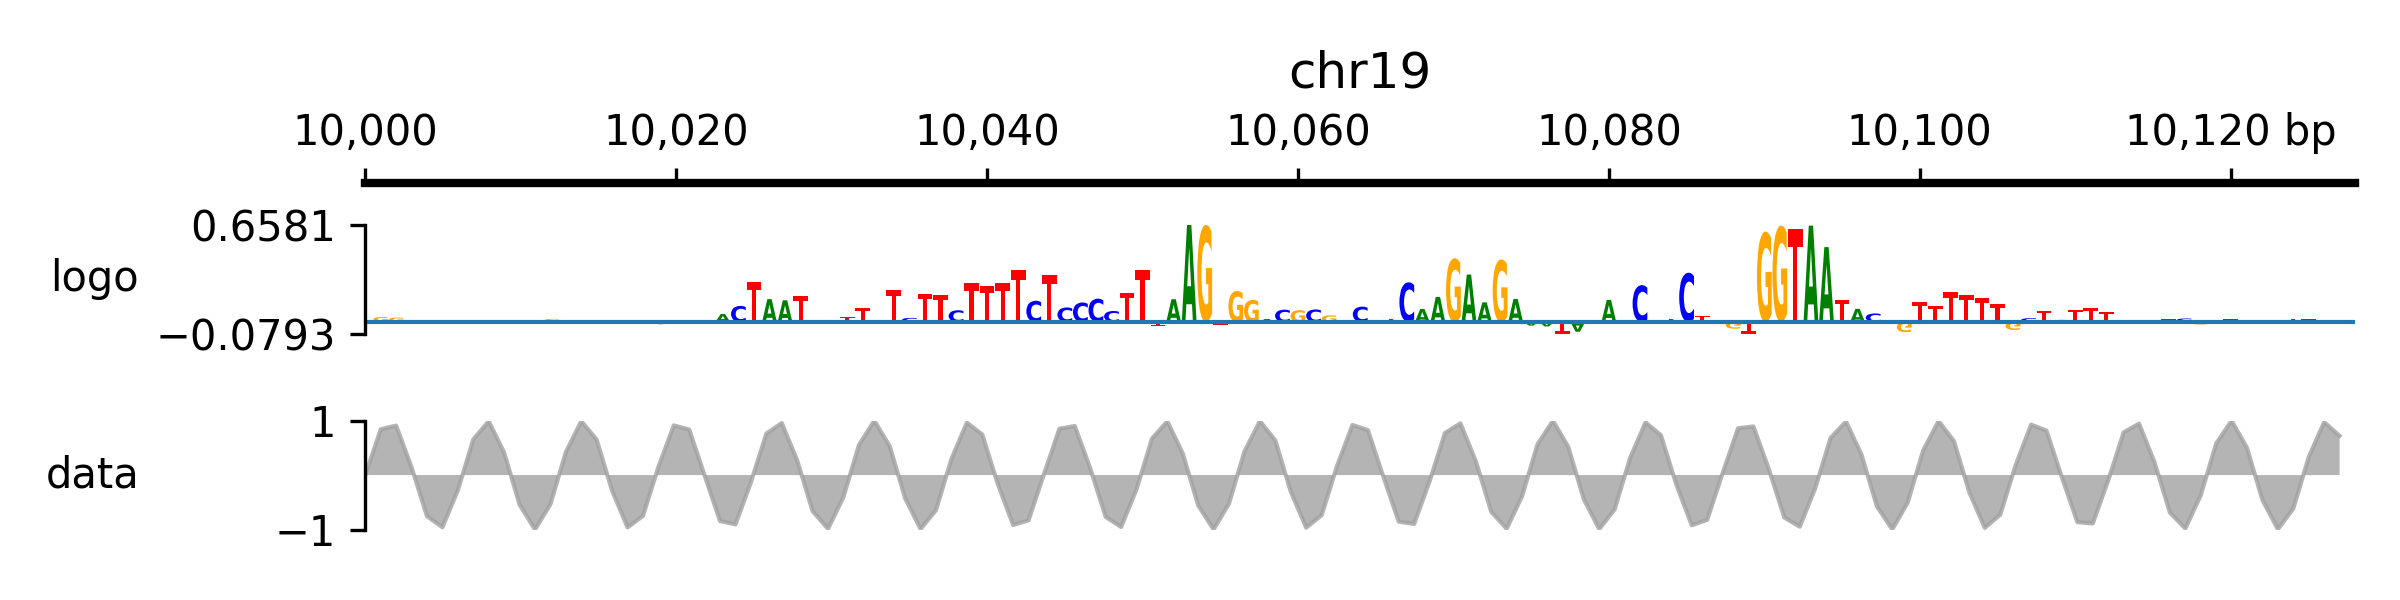
- class pygv.tracks.logo_track.LogoTrack(track: str = '', **kwargs)#
Sequence logo track. The implementation is built on the top of logomaker. After creating the track object, logo matrix should be assigned using
values.- Parameters:
track (str) – Placeholder
kwargs –
- color_scheme(str, dict, or array with length 3)
Specification of logo colors. Default is ‘gray’. Can take a variety of forms.
(str) A built-in Logomaker color scheme in which the color of each
- character is determined that character’s identity. Options are,
For DNA/RNA: ‘classic’, ‘grays’, or ‘base_paring’.
For protein: ‘hydrophobicity’, ‘chemistry’, or ‘charge’.
(str) A built-in matplotlib color name such as ‘k’ or ‘tomato’
(list) An RGB array, i.e., 3 floats with values in the interval [0,1]
- (dict) A dictionary that maps characters to colors, E.g.,
- {‘A’: ‘blue’,
’C’: ‘yellow’, ‘G’: ‘green’, ‘T’: ‘red’}
- font_name: (str)
The character font to use when rendering the logo. For a list of valid font names, run logomaker.list_font_names().
- stack_order: (str)
Must be ‘big_on_top’, ‘small_on_top’, or ‘fixed’. If ‘big_on_top’, stack characters away from x-axis in order of increasing absolute value. If ‘small_on_top’, stack glyphs away from x-axis in order of decreasing absolute value. If ‘fixed’, stack glyphs from top to bottom in the order that characters appear in the data frame.
- center_values: (bool)
If True, the stack of characters at each position will be centered around zero. This is accomplished by subtracting the mean value in each row of the matrix from each element in that row.
- flip_below: (bool)
If True, characters below the x-axis (which correspond to negative values in the matrix) will be flipped upside down.
- shade_below: (float in [0,1])
The amount of shading to use for characters drawn below the x-axis. Larger numbers correspond to more shading (i.e., darker characters).
- fade_below: (float in [0,1])
The amount of fading to use for characters drawn below the x-axis. Larger numbers correspond to more fading (i.e., more transparent characters).
- fade_probabilities: (bool)
If True, the characters in each stack will be assigned an alpha value equal to their height. This option only makes sense if df is a probability matrix. For additional customization, use Logo.fade_glyphs_in_probability_logo().
- Raises:
ValueError will be raised if the len the values property is not equal to the span of plotting region as defined as end - start –
Examples
(
Source code,png,pdf)
- property values#
A matrix specifying character heights and positions. Rows correspond to positions while columns correspond to characters. If providing a numpy array, columns must be standard nucleotides (4)/amino acids (20) sorted alphabetically. If providing a pd.DataFrame, column names must be single characters and row indices must be integers.
- Returns:
shape: sequence_len, acgt (4)
- Return type:
pd.DataFrame