Note
Go to the end to download the full example code.
Apply the same scale to multiple tracks#
A shared scale can be applied to multiple numerical tracks via GenomeViewer’s add_group_autoscale() method.
from pygv.viewer import GenomeViewer
from pygv.tracks.bigwig_track import PairedStrandSpecificTracks

# create two tracks
track1 = PairedStrandSpecificTracks(
    "../examples/data/K562_GROcap_hg38_pl.chr1.bw",
    "../examples/data/K562_GROcap_hg38_mn.chr1.bw",
    draw_y_independently=True,
    name="default", y_label_rotation="vertical", y_label_ha="center")
track2 = PairedStrandSpecificTracks(
    "../examples/data/K562_GROcap_hg38_pl.chr1.bw",
    "../examples/data/K562_GROcap_hg38_mn.chr1.bw",
    draw_y_independently=True,
    name="shrunken", y_label_rotation="vertical", y_label_ha="center")
For the second track, we shrink all value to 1/10 of their original ones so that we can conveniently check the effect of group label
track2.data_transform = lambda x: x * 0.1
Let’s create the first GV where no group label will be applied
gv1 = GenomeViewer()
gv1.add_track(track1)
gv1.add_track(track2)
gv1.plot("chr1", 201954851, 201955948)
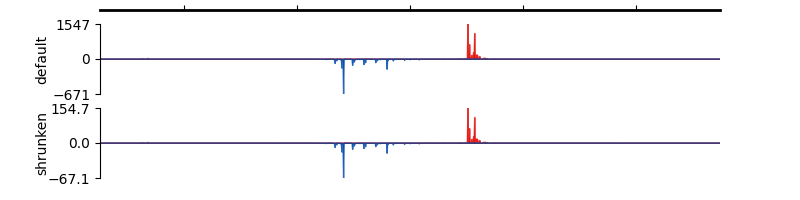
array([<Axes: title={'center': 'chr1'}, ylabel='default'>,
       <Axes: ylabel='shrunken'>], dtype=object)
Let’s create the second GV where we apply group label to the two tracks
gv2 = GenomeViewer()

gv2.add_track(track1)
gv2.add_track(track2)

gv2.add_group_label(0, 1, "Group 1")
gv2.plot("chr1", 201954851, 201955948)
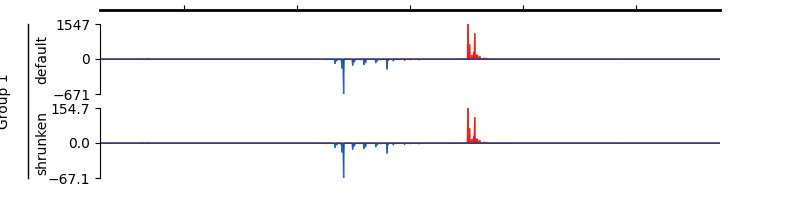
array([<Axes: title={'center': 'chr1'}, ylabel='default'>,
       <Axes: ylabel='shrunken'>], dtype=object)
Group autoscale can also be created by providing the names of the tracks:
gv3 = GenomeViewer()
gv3.add_track(track1)
gv3.add_track(track2)

gv3.add_group_label_by_name("default", "shrunken", "Group 1")
gv3.plot("chr1", 201954851, 201955948)

array([<Axes: title={'center': 'chr1'}, ylabel='default'>,
       <Axes: ylabel='shrunken'>], dtype=object)
Total running time of the script: (0 minutes 0.407 seconds)