Note
Go to the end to download the full example code.
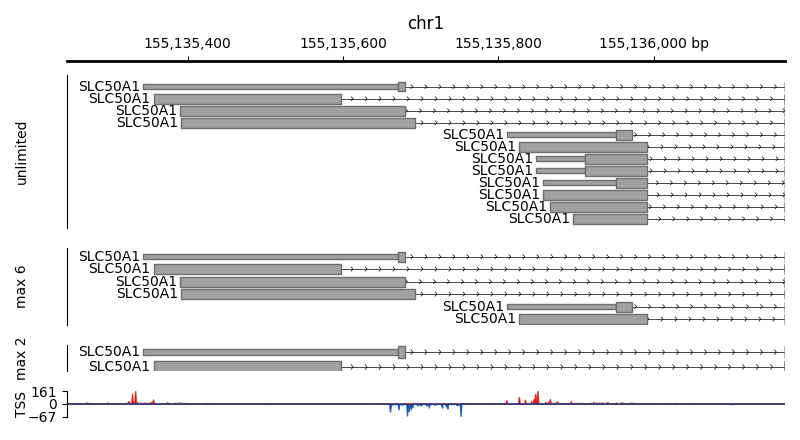
Adjust the number of feature lanes allowed#
import matplotlib.pyplot as plt
from pygv.viewer import GenomeViewer
from pygv.tracks.bed_track import BedTrack
from pygv.tracks.bigwig_track import PairedStrandSpecificTracks

gv = GenomeViewer()
unrestricted_track = BedTrack(
    "../examples/data/gencodeV24.sub.bed.gz",
    name="unlimited", height=1/2, line_width=0.5,
    show_name=True, y_label_rotation="vertical", y_label_ha="center")
gv.add_track(unrestricted_track)
max_6lanes_track = BedTrack(
    "../examples/data/gencodeV24.sub.bed.gz",
    name="max 6", height=1/2, allowed_feature_lanes=6, line_width=0.5,
    show_name=True, y_label_rotation="vertical", y_label_ha="center")
gv.add_track(max_6lanes_track)
max_2lanes_track = BedTrack(
    "../examples/data/gencodeV24.sub.bed.gz",
    name="max 2", height=1/2, allowed_feature_lanes=2, line_width=0.5,
    show_name=True, y_label_rotation="vertical", y_label_ha="center")
gv.add_track(max_2lanes_track)
tss_track = PairedStrandSpecificTracks(
    "../examples/data/K562_GROcap_hg38_pl.chr1.bw",
    "../examples/data/K562_GROcap_hg38_mn.chr1.bw",
    draw_y_independently=True,
    name="TSS", y_label_rotation="vertical", y_label_ha="center")
gv.add_track(tss_track)
gv.plot("chr1", 155135244, 155136169, height_scale_factor=0.4)
plt.tight_layout()
Total running time of the script: (0 minutes 0.530 seconds)