Note
Go to the end to download the full example code.
Inward y-ticks#
By default, the y-ticks are aligned to the center of the tick lines.
If you want to plot the tick labels strictly inside the track, you can
use the pygv.tracks.track.Track.inward_yticks property.
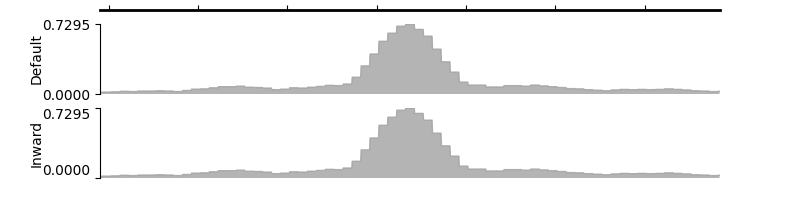
array([<Axes: title={'center': 'chr19'}, ylabel='Default'>,
       <Axes: ylabel='Inward'>], dtype=object)
from pygv.viewer import GenomeViewer
from pygv.tracks.bigwig_track import BigWigTrack
gv = GenomeViewer()
default_track = BigWigTrack(
    "../examples/data/K562_DNase_hg38_ENCFF413AHU.chr19.bigWig",
    name="Default", y_label_rotation="vertical", y_label_ha="center")
default_track.inward_yticks = False
gv.add_track(default_track)
inward_track = BigWigTrack(
    "../examples/data/K562_DNase_hg38_ENCFF413AHU.chr19.bigWig",
    name="Inward", y_label_rotation="vertical", y_label_ha="center")
inward_track.inward_yticks = True
gv.add_track(inward_track)
gv.plot("chr19", 7496780, 7498169)
Total running time of the script: (0 minutes 0.112 seconds)