Note
Go to the end to download the full example code.
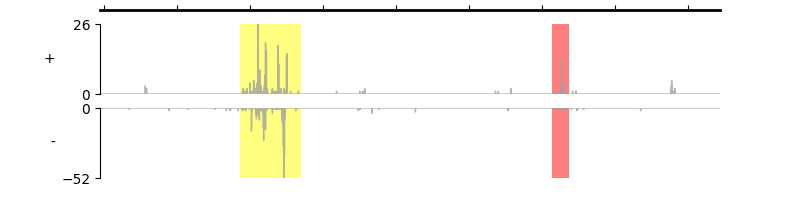
Highlight regions on all tracks#
By calling set_highlight_regions() method, you can highlight multiple regions on each track.
array([<Axes: title={'center': 'chr1'}, ylabel='+'>, <Axes: ylabel='-'>],
      dtype=object)
from pygv.viewer import GenomeViewer
from pygv.tracks.bigwig_track import BigWigTrack
gv = GenomeViewer()

# draw positive and negative values independently
track_1 = BigWigTrack(
    "../examples/data/K562_GROcap_hg38_pl.chr1.bw",
    name="+", )
gv.add_track(track_1)
track_2 = BigWigTrack(
    "../examples/data/K562_GROcap_hg38_mn.chr1.bw",
    name="-", )
gv.add_track(track_2)
# highlight two loci chr1:116824346-116828474 and chr1:116845712-116846846
# the first regions will be highlighted in yellow, the second one in red.
gv.set_highlight_regions([116824346, 116845712], [116828474, 116846846], ["yellow", "red"])
gv.plot("chr1", 116814729, 116857188)
Total running time of the script: (0 minutes 0.139 seconds)