Note
Go to the end to download the full example code.
Bed Track#
Create a BedTrack.
import matplotlib.pyplot as plt
from pygv.viewer import GenomeViewer
from pygv.tracks.bed_track import BedTrack
from pygv.tracks.bigwig_track import PairedStrandSpecificTracks
gv = GenomeViewer()
The input file here is encoded in standard BED12 format with exons and CDS
information stored in the 7th~12th fields.
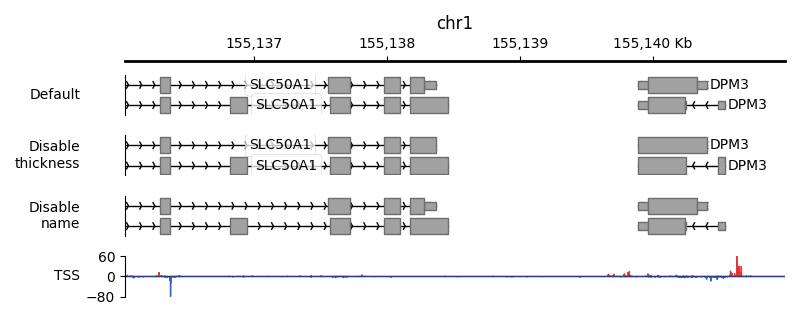
First, we create a BedTrack and we allow up to two annotation lanes. In this
case, PyGV will plot each exon and apply thickness to the CDS.
default_track = BedTrack(
    "../examples/data/gencodeV24.sub.bed.gz",
    name="Default", height=1/2, allowed_feature_lanes=2, y_label_ha="right")
gv.add_track(default_track)
Second, we create a BedTrack and we override the default behavior by telling PyGV to not apply
thickness to the CDS even though the information presents in the annotation file.
no_thickness_track = BedTrack(
    "../examples/data/gencodeV24.sub.bed.gz",
    name="Disable\nthickness", height=1/2, allowed_feature_lanes=2, plot_thickness=False,
    y_label_rotation=0, y_label_ha="right",)
gv.add_track(no_thickness_track)
Third, we create a BedTrack and we override the default behavior by telling PyGV to not draw
feature names, in this case, to hide genes’ names.
track = BedTrack(
    "../examples/data/gencodeV24.sub.bed.gz",
    name="Disable\nname", height=1/2, allowed_feature_lanes=2, show_name=False,
    y_label_rotation=0, y_label_ha="right",)
gv.add_track(track)
Last, we add a PairedStrandSpecificTracks to show transcription initiation around these annotations.
tss_track = PairedStrandSpecificTracks(
    "../examples/data/K562_GROcap_hg38_pl.chr1.bw",
    "../examples/data/K562_GROcap_hg38_mn.chr1.bw",
    draw_y_independently=True,
    name="TSS", y_label_rotation=0, y_label_ha="right")
gv.add_track(tss_track)
And here is the result:
gv.plot("chr1", 155136034, 155140992, height_scale_factor=0.8)
plt.tight_layout()
Total running time of the script: (0 minutes 0.308 seconds)