Note
Go to the end to download the full example code.
Overlaying BigWig Tracks#
Create a OverlayingTrack
to show signals from multiple BigWig files within a single track.
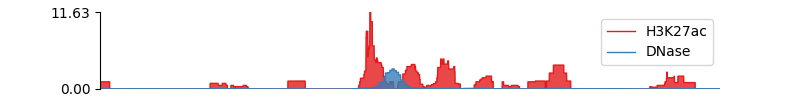
[<Axes: title={'center': 'chr19'}>]
from pygv.viewer import GenomeViewer
from pygv.tracks.bigwig_track import OverlayingTrack
gv = GenomeViewer()
track = OverlayingTrack(
    ("../examples/data/K562_H3K27ac_ENCFF779QTH.chr19.bigWig",
     "../examples/data/K562_DNase_hg38_ENCFF413AHU.chr19.bigWig",),
    labels=("H3K27ac", "DNase", ))
gv.add_track(track)
gv.plot("chr19", 13232024, 13237758)
Total running time of the script: (0 minutes 0.102 seconds)